Who won the Olympics?
The Land of the Long White Cloud can play more than rugby. But there are others that are catching up.
This is a free post from Our Long Walk, my blog about the economic past, present, and future of South Africa. If you enjoy it and want to support more of my writing, please consider a paid subscription to the twice-weekly posts that include my columns, guest essays, interviews and summaries of the latest relevant research.
Please follow the new Our Long Walk LinkedIn page to access more links and discussions related to my posts.
Yesterday the Games of the XXXIII Olympiad ended. It was a tremendous success. The French really do know how to throw a party. And Paris blended its architecture with éblouissement, leaving all of us watching in awe.
The athletes came to the party too. Highlights for me: Femke Bol in the final leg of the 4 x 400m mixed relay, Armand Duplantis’s world record and gold medal in the pole vault, and, without doubt, Letsile Tebogo of Botswana winning the men’s 200m in style.
But which country can be most satisfied with their performance at the Games?
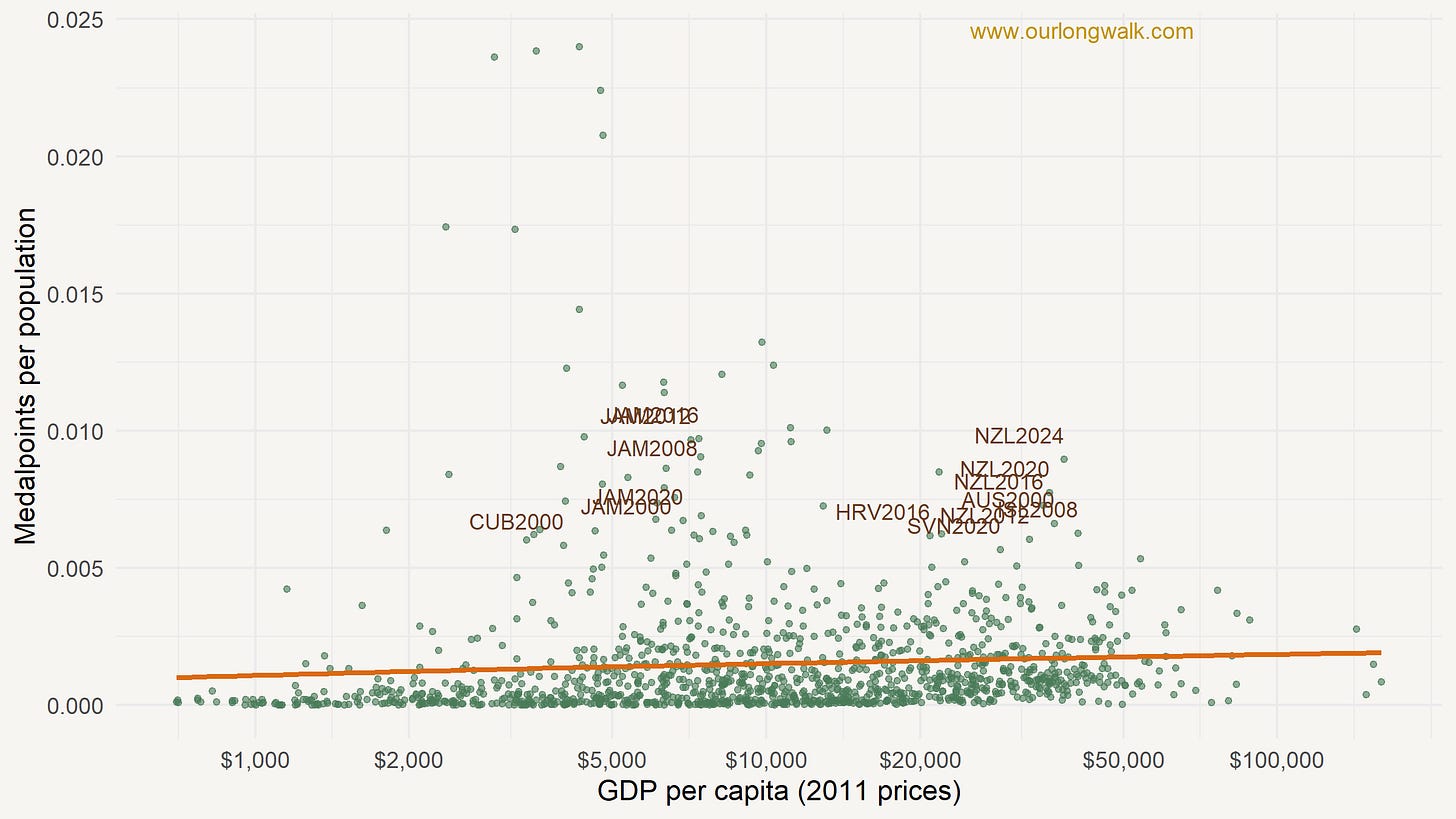
There has been much written about this topic.1 But to answer that question without nifty econometrics, I do something basic: I calculate the medalpoints per population for all countries that have participated in the Games since 1900, won medals, and have GDP and population statistics available.2 A gold medal counts as three medalpoints, silver two and bronze one. I then plot, in Figure 1 below, a scatter plot of medalpoints per population and (the log of) GDP per capita. Each dot thus represents a country-year pair. I also plot a fitted line over all observations.
The fitted line is slightly positive, meaning that wealthier countries tend to win more medalpoints per population, though less than I had anticipated. I then plot the names of the countries that are two standard deviations from the fitted line, but only for countries after the year 2000. (Finland and Sweden were massive outliers in the first half of the twentieth century.)
A few observations. Since 2000, there have been only seven countries with two-standard-deviation outperformance: Australia, Cuba, Croatia, Iceland, Jamaica, New Zealand and Slovenia. Five of the seven have only done so once. Two are repeated outperformers: Jamaica (in 2000, 2008, 2012, 2016, and 2020 – the Age of Bolt) and New Zealand (every year since 2012). Jamaica failed to live up to their own high standards in 2024. That makes New Zealand, the Land of the Long White Cloud, the clear gold medalist in 2024.
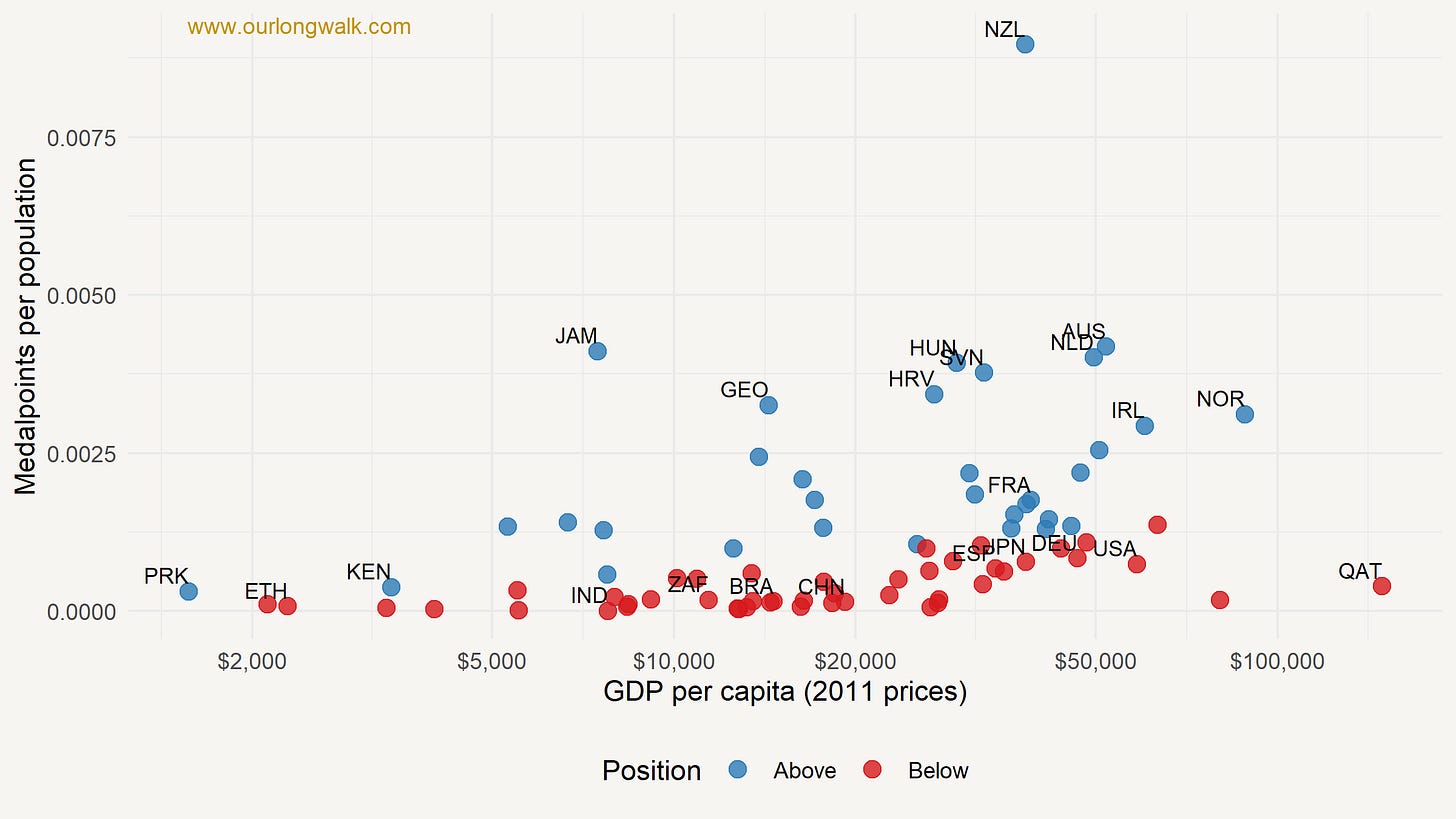
That New Zealand can play more than rugby is clear from Figure 2. Here, I plot the same graph as above, but now just for their 2024 performance.3 Blue dots represent overperformance (above the long-run fitted line) while red dots represent underperformance. I plot the names of the big overperformers, and a few others.
Some findings: Both China and the USA, by far the top two medalists, are underperformers, owing to their huge population size (China) and wealth (US). Big and rich countries can overperform, though: hosts France overperformed while neighbours Germany underperformed. Norway, one of the wealthiest countries in the dataset, was a big overperformer, while Qatar, the wealthiest, was a big underperformer. At the other end of the income distribution, Kenya overperformed, while Ethiopia, a regular overperformer, underperformed.
While New Zealand was the clear victor, we might ask who the runners-up were. The answer is in Figure 3, which ranks the top ten countries in 2024 and plots their ranking for the previous six Olympics. In 2024, Australia comes in second, with Jamaica the bronze medalists.
But the other countries on that list and their paths to the top ten make for the most interesting reading. A first observation is that medal tallies are not random. There tends to be persistence in performance; once you’re in the top ten, you tend to stay there. But there are also clear signs of improvement for some. Take Croatia (HRV), which was only the 35th-ranked country in 2000, moved into the top twenty in 2004 and into the top ten in 2012. The Netherlands has made steady improvements since 2008, ultimately ending in fourth place. Ireland had only once reached the top twenty (in 2012, when they came in twentieth), but edged into a top ten spot this year. Or let’s take our 2024 winner: New Zealand was not even in the top twenty in 2000, but moved into the top ten in 2004, and has been in the top two since 2012. It would be fascinating to investigate what New Zealand did to achieve this.
There are notable other patterns too. Perennial overperformers Norway had a terrible 2012 and 2016 Olympics. Australia was the gold medalist with the Sydney Olympics in 2000, then went through a dip, finishing outside the top ten in 2016, only to recover. They would hope to continue the trend into 2032, when they host the Olympics in Brisbane.
There is much more to study about medalnomics, splitting the results by male or female performance or by sports code, for example. I hope others will take on the challenge. For readers interested in South Africa’s performance (and a few policy proposals for improvement), please subscribe, as I plan to do a more thorough review in due course.
For now, let me end with the Māori saying ‘ehara taku toa, he takitahi, he toa takitini’ (my success should not be bestowed onto me alone, as it was not individual success but success of a collective), perhaps some wisdom for other countries hoping to emulate their performance. Congratulations, New Zealand, well done on winning the 2024 Olympics!
‘Who won the Olympics?’ was first published on Our Long Walk. I thank Jan-Hendrik Pretorius for data support. The image was created with Midjourney v6.
See: Bernard, A.B. and Busse, M.R., 2004. Who wins the Olympic Games: Economic resources and medal totals. Review of economics and statistics, 86(1), pp.413-417; Lui, H.K. and Suen, W., 2008. Men, money, and medals: An econometric analysis of the Olympic Games. Pacific Economic Review, 13(1), pp.1-16; Rewilak, J., 2021. The (non) determinants of Olympic success. Journal of sports economics, 22(5), pp.546-570.
I use the Maddison Project data. Available here: https://www.rug.nl/ggdc/historicaldevelopment/maddison/releases/maddison-project-database-2023
I use 2022 (and, where necessary, 2021) population and GDP per capita numbers, again from the Maddison Project.


Brilliant analysis. NZ with 20 medals for a 5 million population was a star performer. Other factors to consider:
Paris Olympics is the first games to achieve full gender parity. In 1924 women made up only 4,4% of participants. Countries will differ, but equitable gender participation seems to be essential for a top overall performance. Could this be a factor in India's (population 1,5 billion) underperformance with only 5 medals?
Rich countries can fund sports with high barriers to participation - rowing, canoeing, sailing, equestrian etc. - and have the structures and means to pinpoint development and reward programmes. With new sports being added all the time, poorer nations are at a disadvantage. Great Britain's 15 medals in 1996 kickstarted the country into a concerted National Lottery funding programme for Olympic sports that resulted in 65 medals per games for 2012 through 2024. For the Paris games, National Lottery was £246 million for Olympic sport development (cycling £29 million, rowing £24 million, athletics £23 million etc. with even BMX, surfing, sport climbing, skateboarding benefitting) and £70 million for performance awards. Shed a tear for our silver medallist, Jo-Ané van Dyk who, according to reports, received zilch support from Athletics SA.
Be that as it may, Paris 2024 set new standards in its sheer joie de vivre and bringing the city of light to the people.