

Inequality is not new
Nor is it an emergency

At the end of last year, the G20 has decided that the world faces an ‘inequality emergency’. A committee of eminent economists, led by Joseph Stiglitz, warns that 83% of countries now suffer from ‘high inequality’, defined as a Gini coefficient above 0.4. They propose an International Panel on Inequality, national ‘Inequality Reduction Plans’, and a new architecture of global rules to bring the top 10% closer to the bottom 40%.
There is moral passion here, and some sensible policy ideas. But the language of ‘emergency’ conceals something important. Inequality is being treated as the thing we really care about. It is not.
People care about poverty and social mobility because they have direct consequences for their lived experience: whether you can feed your children, whether your life chances are truncated at birth, whether your effort counts for anything. Once you remember that, the Gini starts to look like a slightly strange hero. If your only objective is to lower the Gini, there are quick fixes. Expropriating the richest hundred citizens would do the trick. So would a devastating war that wipes out urban capital. Few people would celebrate either, because neither tells you anything about whether people are less poor or more mobile. The indicator is not the objective.
The second assumption baked into the ‘inequality emergency’ framing is that modern capitalism is the villain of the piece. The report leans heavily on the idea that rising inequality is the child of neoliberalism and globalised markets since the 1980s, and that what came before was more egalitarian.
That is, at best, incomplete. Here’s why.
Historians who have spent the last decade reconstructing the ‘new history of old inequality’ paint a more uncomfortable picture. Using social tables, tax rolls and probate records, they find that, across much of Western Europe and the United States, inequality rose almost monotonically from the late Middle Ages to the eve of the First World War. Only two great shocks – the Black Death in the fourteenth century and the period 1914–1945 – really dented it. Guido Alfani’s long-run survey for Europe summarises the stylised facts: from about 1450 to 1900, both income and wealth Ginis tended to drift steadily upwards, with the top 10% often owning 80–90% of all wealth.
Inequality is not a new irritant unleashed by five decades of neoliberalism. It seems to be the default setting of agrarian, hierarchical societies.
That raises a natural question for South Africa: when did we become so unequal?
South Africa today tops the World Bank’s global ranking of income inequality, with a Gini around 0.63, and wealth is even more concentrated: estimates suggest the top 10% own more than 85% of household wealth and the wealth Gini is above 0.9. It is tempting to pin that entirely on apartheid and twentieth-century capitalism. In a recent paper, I tried to push the story much further back by reconstructing inequality in the Cape Colony between 1685 and 1844.
The Cape is unusually well documented. The Dutch and then the British left behind a paper trail that would make many European archivists jealous. I draw on four main sources. The first is the opgaafrolle, the annual tax censuses that enumerate almost every free household: the names of the heads, the number of children, the numbers of enslaved and Khoesan workers, and then the key productive assets of the farm – horses, cattle, sheep, vines, grain reaped, wine produced.
The second is the probate inventories of deceased settlers, taken down by the Orphan Chamber in Cape Town, listing furniture, livestock, slaves and tools at death. The third is the slave valuation rolls of 1834, where British appraisers record each enslaved person and the compensation paid to the owners at emancipation. The fourth is a set of tax returns for Khoe mission stations and settlements such as Bethelsdorp, Groenekloof and Swartrivier in the early nineteenth century.
One virtue of this material is that it lets us move beyond ‘social tables’ – those broad group averages that dominated earlier work – and measure inequality within groups, not just between them. That has been one of the key methodological shifts in the new inequality literature: instead of only comparing, say, ‘peasants’ and ‘nobles’, we try to see how unequal peasants were among themselves, and what share of everything the very top 1% captured. At the Cape we can do that for settlers, for slave-owning households, and, to some extent, for Khoe communities.
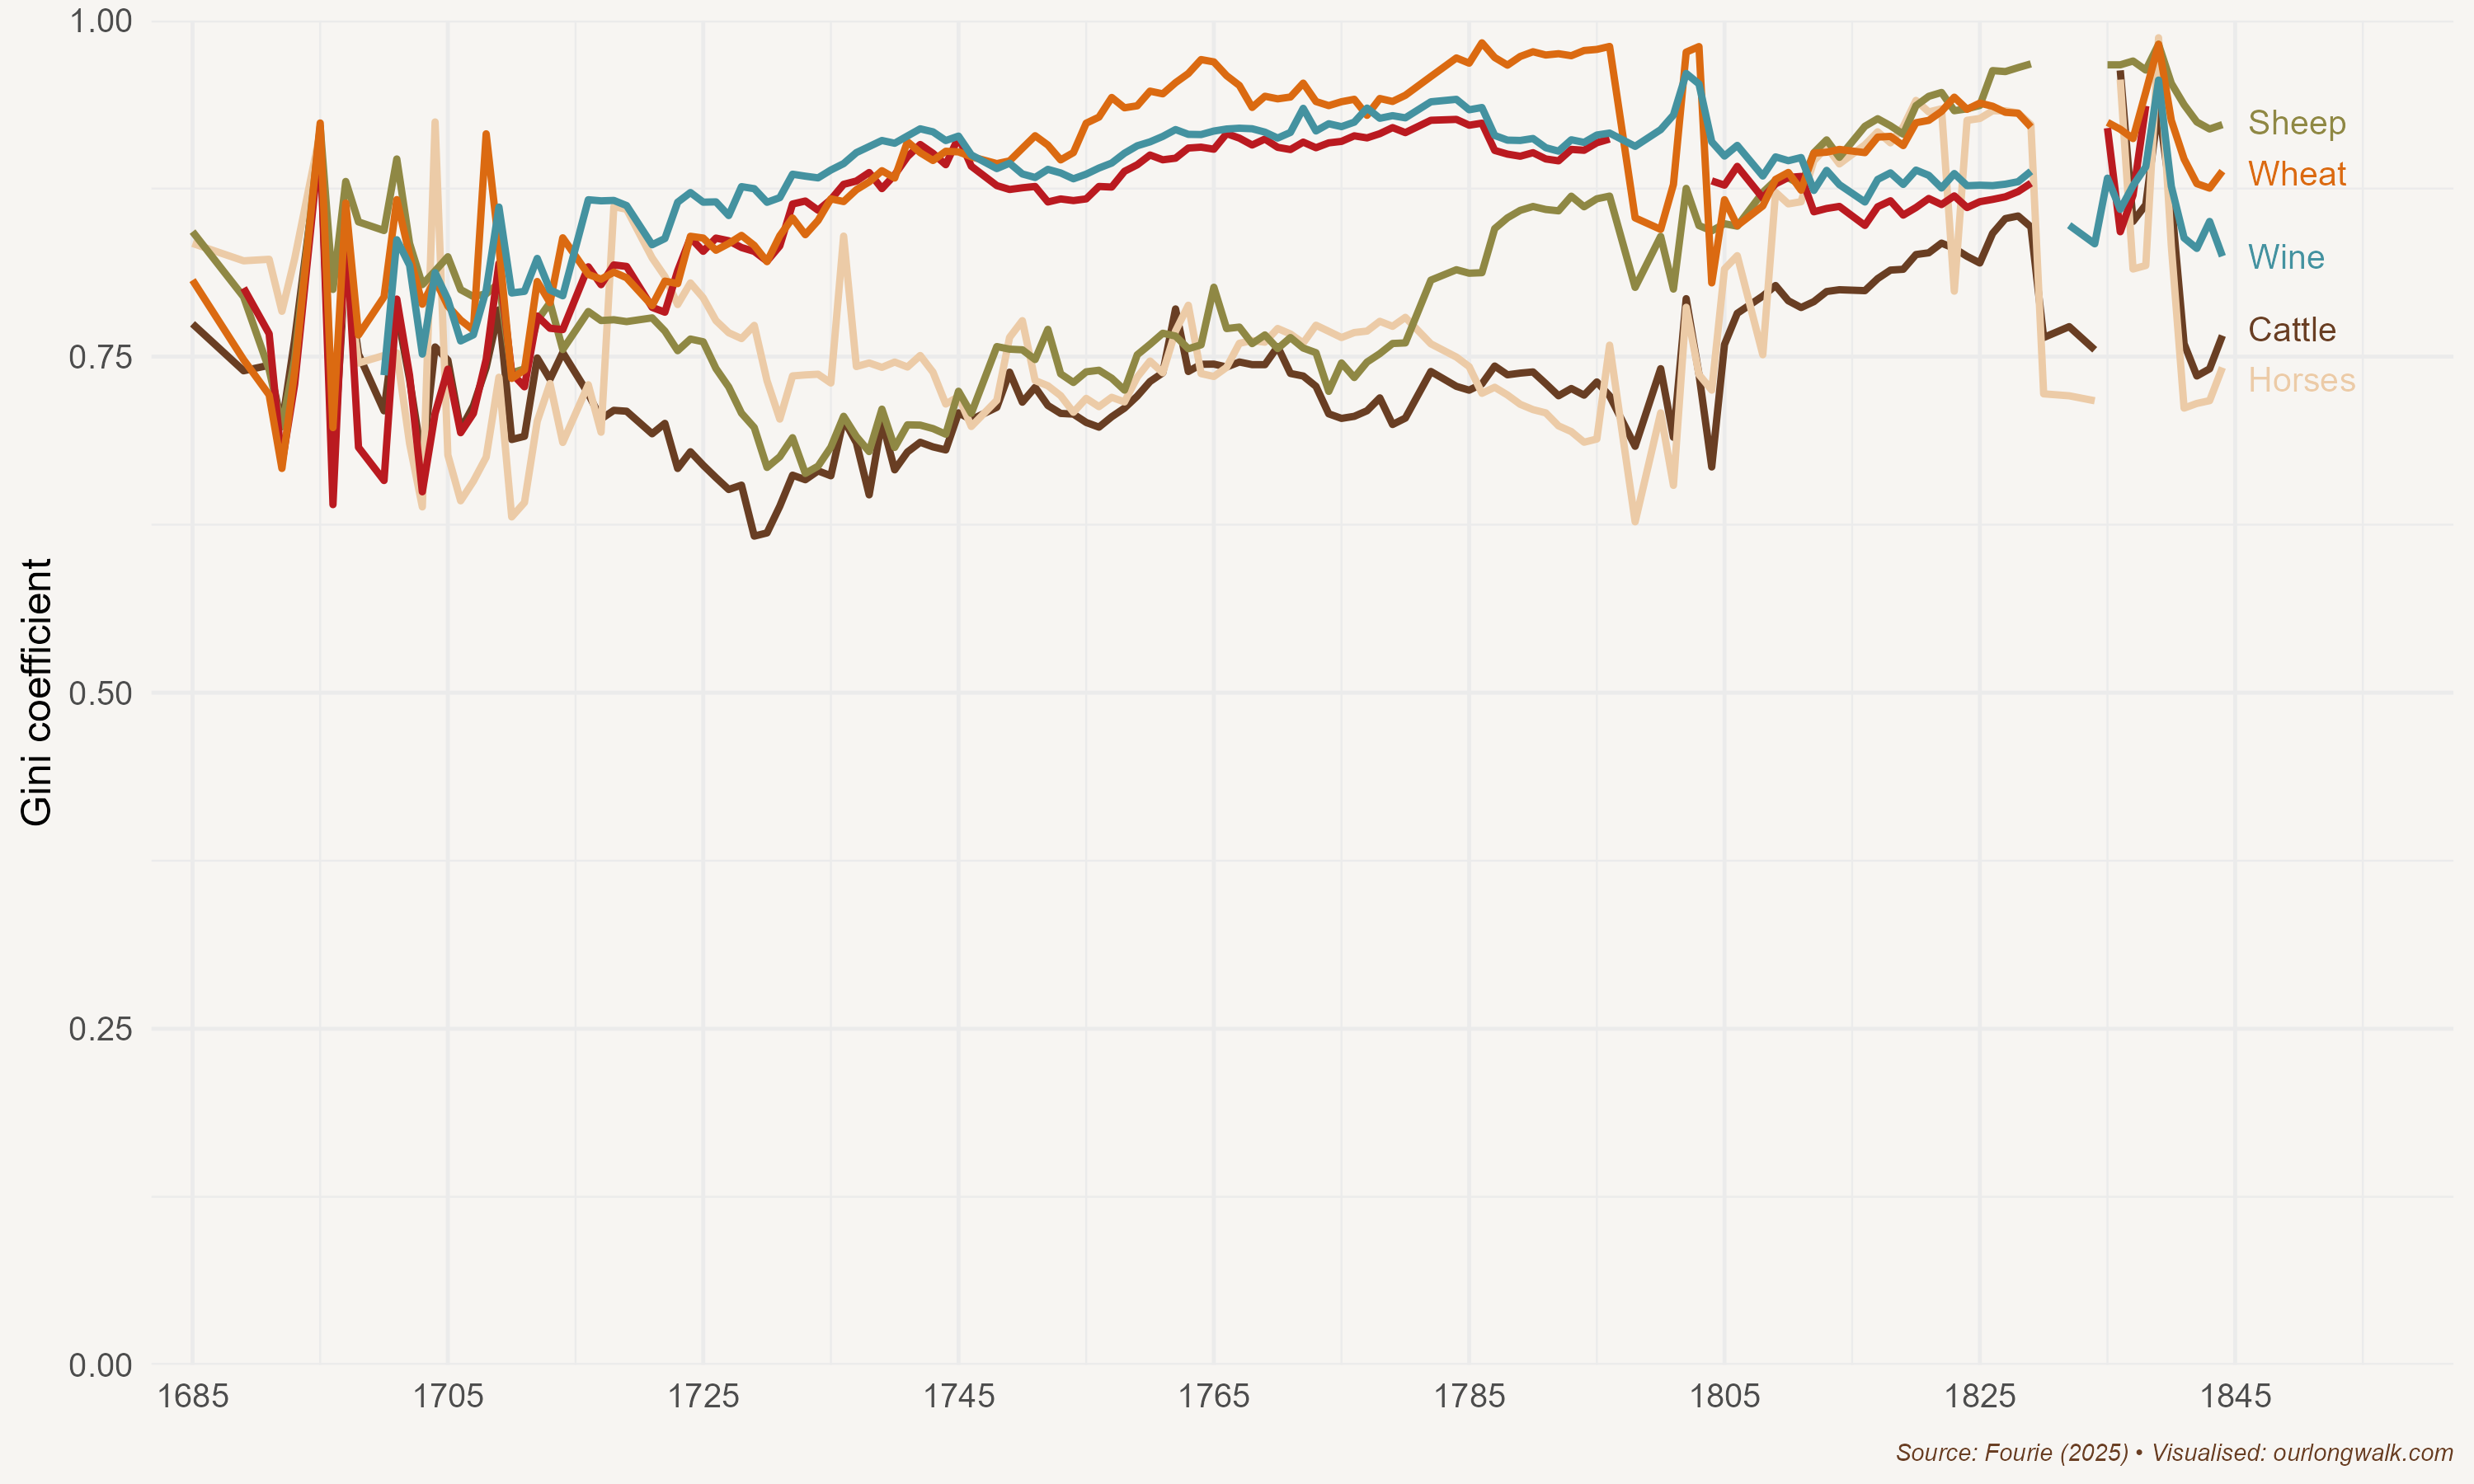
What do the numbers say? In the Stellenbosch-Drakenstein district, the heart of the colony’s grain and wine belt, the Gini coefficient for key assets, as the figure above shows, is never below 0.5 from 1685 to 1844, and often sits between 0.6 and 0.75. When I combine livestock, vines, grain and wine into a single wealth basket, valued at contemporaneous auction prices, the Gini for settler households hovers in that range for a century and a half. The top 1% of settler households hold about 12% of the measured assets in the eighteenth century and closer to 18% in the early nineteenth century.
Adding slavery pushes inequality into truly extreme territory. If you treat enslaved men as separate, asset-less households – which is close to their legal status – the overall Gini in Stellenbosch-Drakenstein approaches 0.9 by the late eighteenth century. Even if you credit enslaved men with an in-kind ‘wage’ equivalent to a sheep a month, the coefficient hardly budges. Using the emancipation data, and adding the majority of settler households who owned no slaves at all, the Gini for slave wealth and compensation jumps into the 0.8–0.9 range in several districts. A small minority of slave-owners dominate the distribution.
The same pattern emerges from a very different source. The probate inventories – essentially estate files for thousands of deceased settlers – show Ginis for cattle, sheep, wagons and ploughs exceeding 0.6, and after 1770 often above 0.7. You do not need very sophisticated econometrics to see the picture: even within the settler population, a small fraction owns most of the productive capital.
What about indigenous communities? For three Khoe settlements around 1825 – Bethelsdorp, Groenekloof and Swartrivier – we have tax returns listing livestock and grain. Here too the within-village Ginis are extreme: usually above 0.75, and for some assets very close to perfect inequality, with a handful of families owning almost all the cattle or sheep. When you pool Khoe and settler households in a district like Swellendam, the combined Gini for cattle reaches 0.92.
Two things follow. First, the Cape was already a brutally unequal society by the late seventeenth century. Inequality between groups was enormous: settlers were wealthier than the enslaved, who in turn typically had more recorded assets than Khoe households. But inequality within each group was also extreme. Among settlers, the within-group Gini is as large as the overall Gini; even if you removed enslaved and Khoe households from the sample, the Cape would still look like one of the most unequal societies we can measure. Among Khoe communities on mission stations, a small elite of cattle owners towered above their neighbours.
Second, inequality has not steadily increased over the last three centuries. There is ample evidence that, like elsewhere, it fluctuated. Take another source: the top incomes in South Africa during the twentieth century, by economists Facundo Alvaredo and AB Atkinson. The graph below shows the top 1% of incomes between 1914 and 2012.
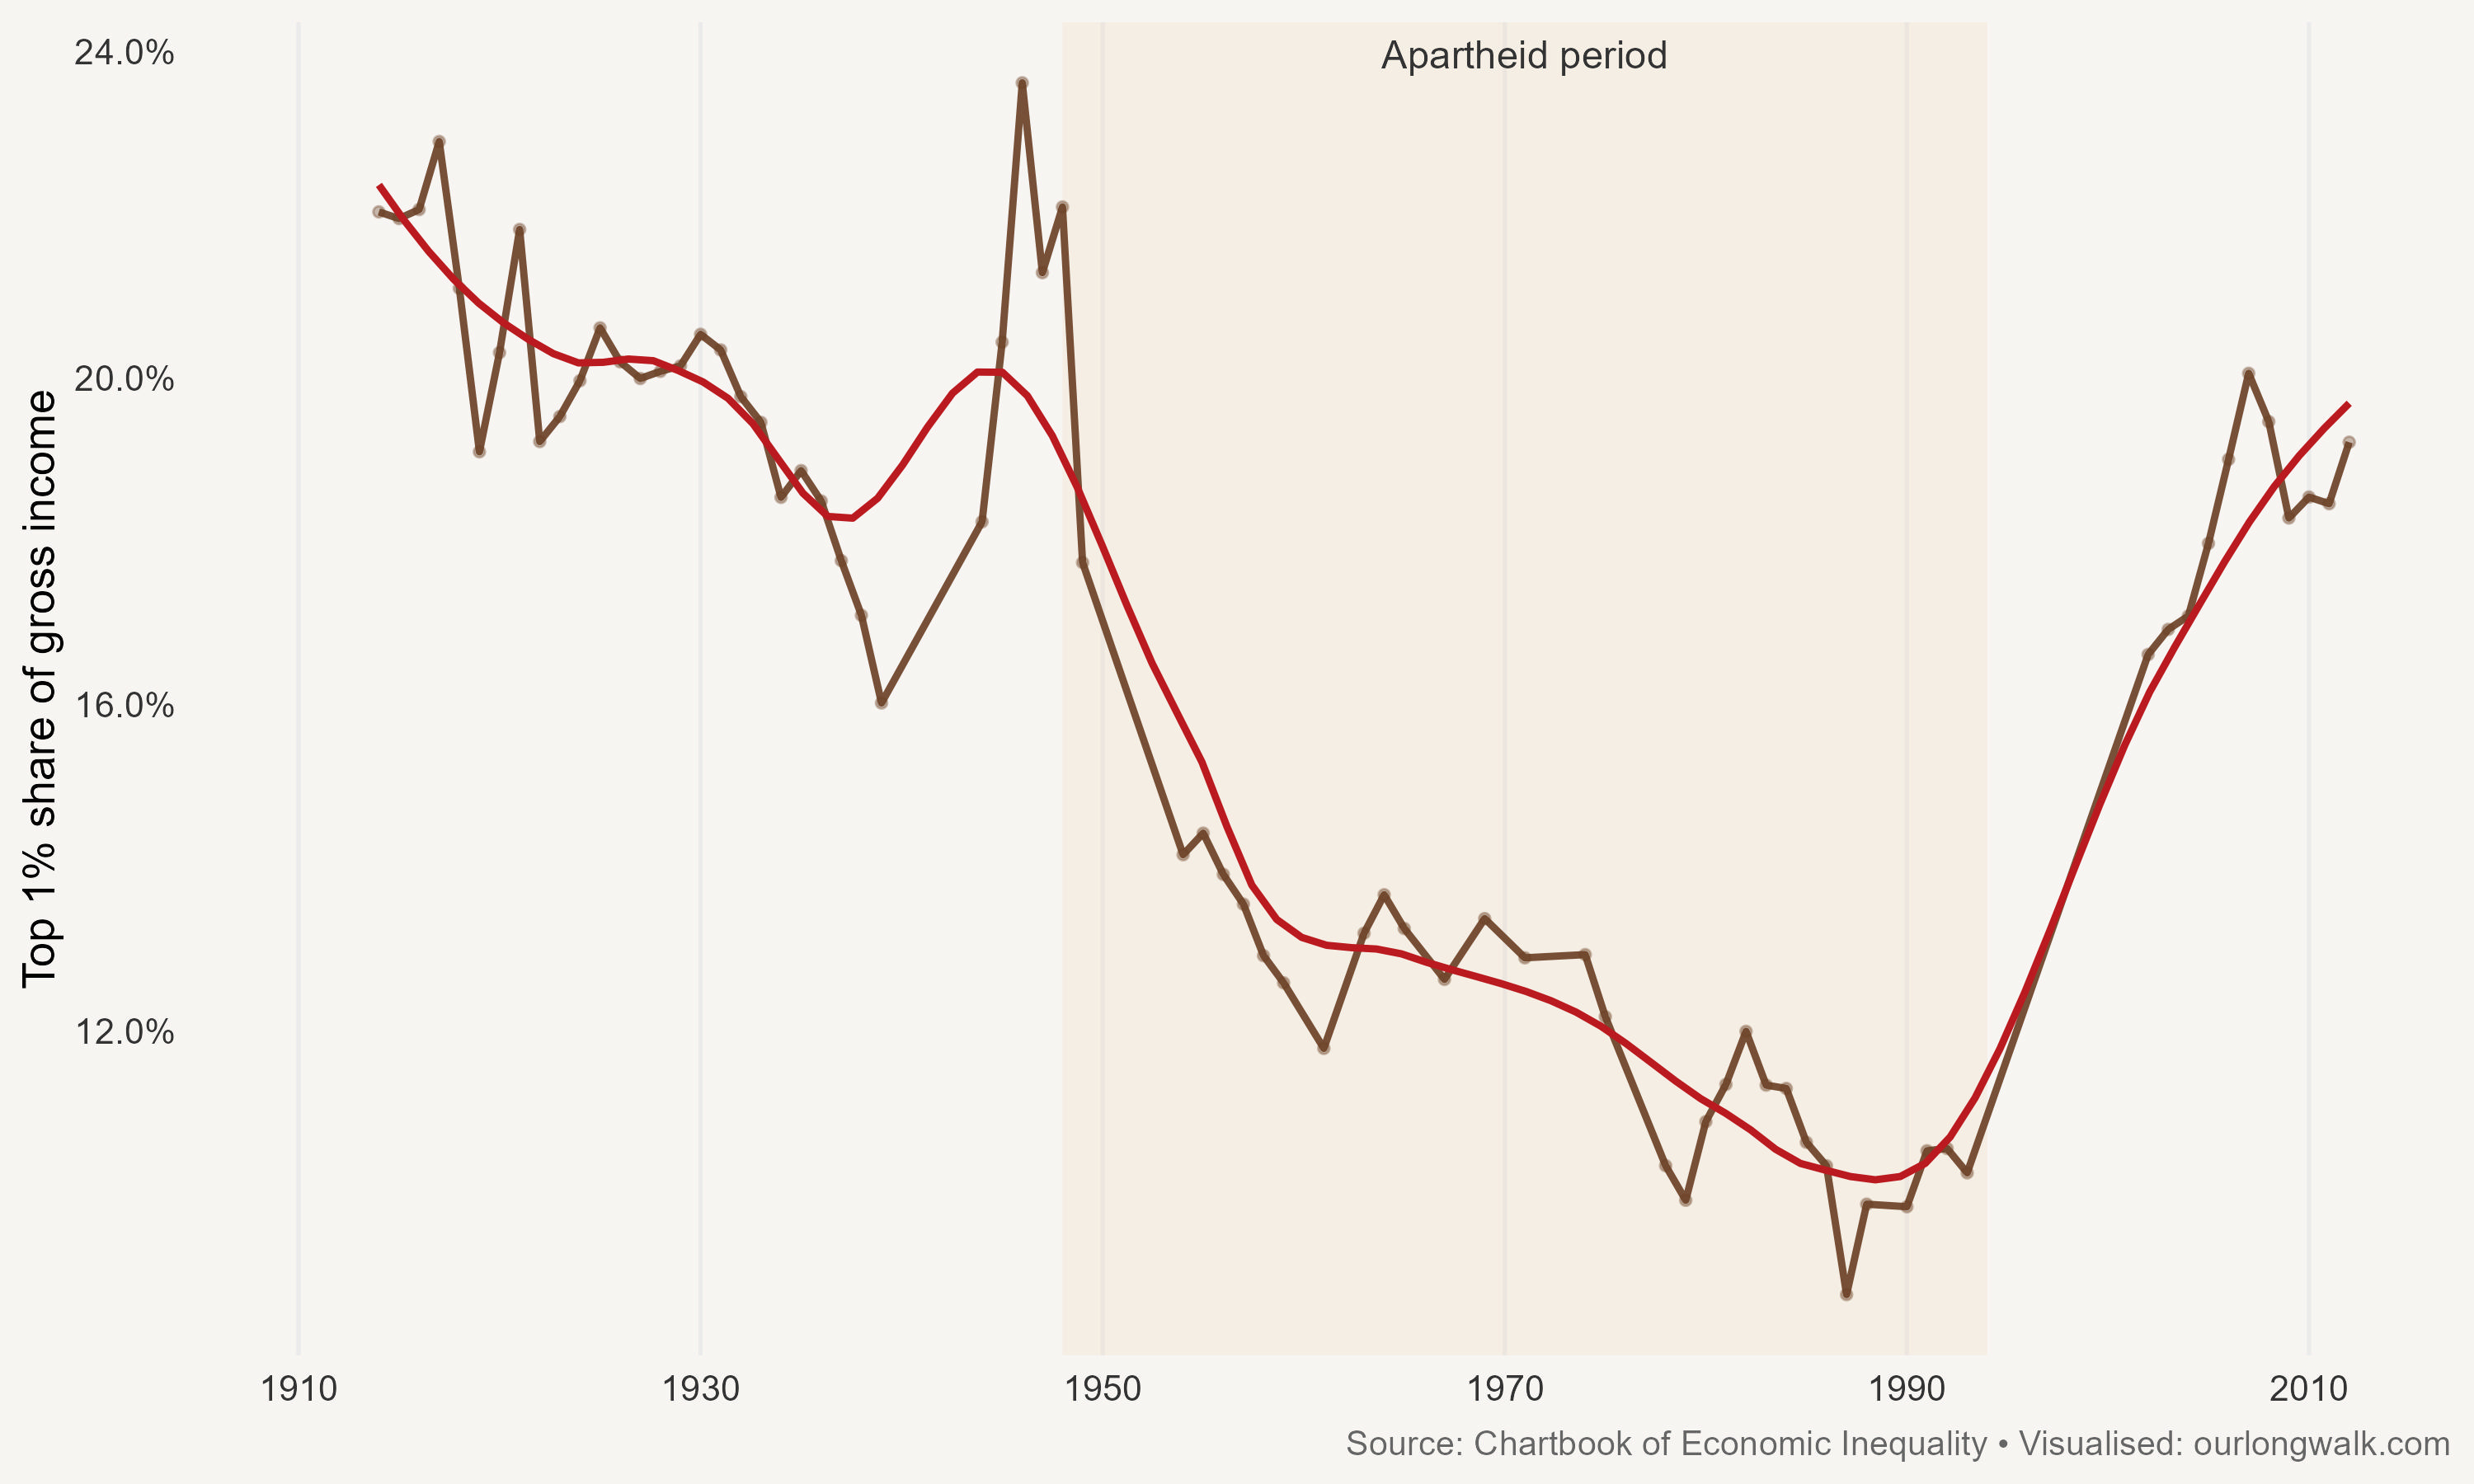
What is clear is the decline in inequality during the apartheid period. No one is arguing for a return to apartheid policies because inequality was lower then than after the arrival of democracy. It reinforces my point that what we care about is not the actual Gini – or, in this case, the top income share – but the potential of those at the bottom of the income distribution to build better lives.
Democracy did bring a different kind of inequality, and here it echoes the eighteenth century again. As I explained in a previous post, new research by Manysheva, Mestieri, and Schauer documents that within-group inequality among black South Africans has increased sharply since the end of apartheid, lifting overall inequality. By contrast, the gulf between racial groups – the central organising principle of apartheid – is steadily narrowing and will continue to shrink.
All of this complicates easy stories about ‘capitalism’ as the source of inequality. South Africa’s inequality today is not just about the arrival of mining capital or industrialisation and apartheid-era exploitation. It has much deeper roots. Long before ‘neoliberalism’, a peasant in rural France, a subject of the Asante state, or a commoner near Great Zimbabwe would have faced three brute facts: deep absolute poverty, short life expectancy, and a social order designed to funnel most surplus to a tiny elite of chiefs, landlords or priests.
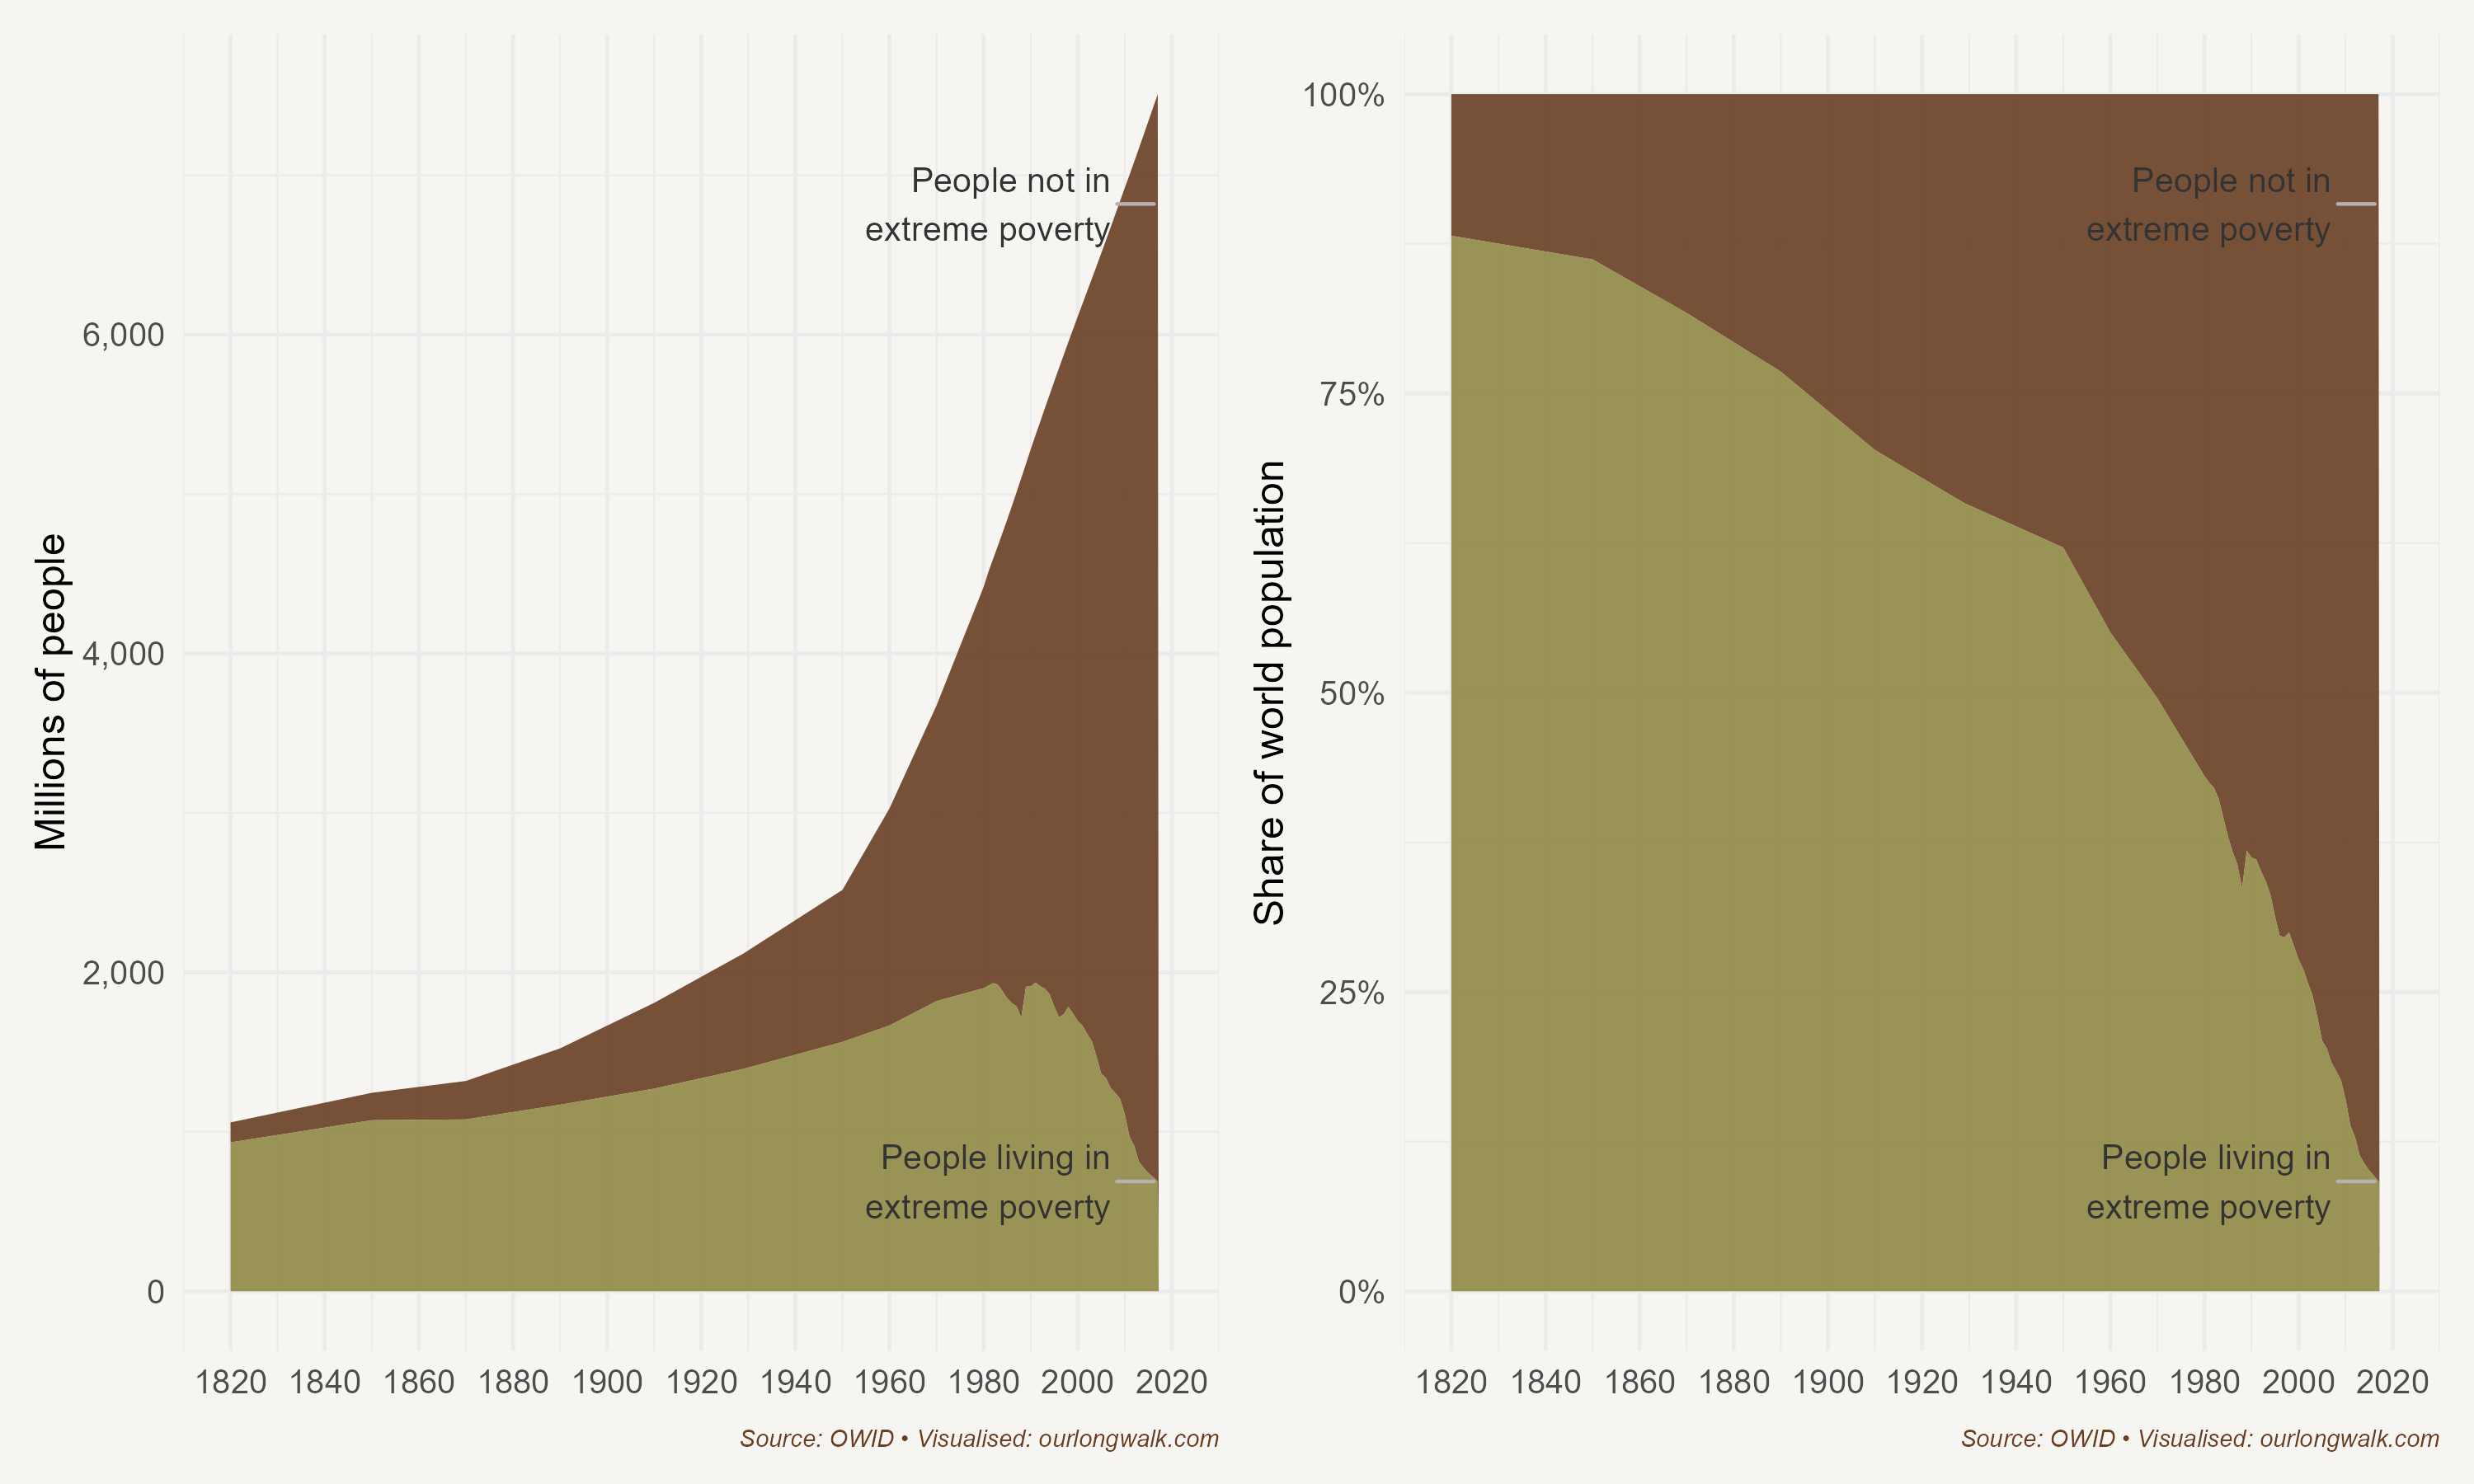
Modern market economies have done something quite different. They have generated the first sustained escape from mass destitution in human history. As the figure above shows, drawn from Our World in Data, the share of the world’s population living in extreme poverty has fallen from well over 80% around 1800 to roughly 10% by 2015. That change has been driven by productivity growth, trade, urbanisation and the spread of technology, combined with states that, at their best, invest in health, education and infrastructure. Inequality has not disappeared; indeed in many places it has risen. But the poor are, on average, far less poor, and the ladders available to climb are far more numerous.
For a young woman in a remote village in Chile or in the mountains of Lesotho, the relevant question is not whether Elon Musk is worth one billion, ten billion or one hundred billion dollars. It is whether she can connect to the internet, attend an online course, or speak to a distant doctor. Low-earth-orbit satellite systems like Starlink are already providing school connectivity in remote Chilean communities such as Caleta Sierra and Sotomó, places that had no adequate digital connection before. In Lesotho, regulators have now granted Starlink a ten-year licence, explicitly framing it as a way to extend broadband into hard-to-reach rural areas. Whatever you think of Musk, that combination of engineering and regulation is likely to matter more for the poorest Basotho than the exact size of his fortune.
Why then the obsession with ‘inequality’ as the organising principle of global policy? Part of the answer is moral: gaps in income and wealth translate into gaps in power and voice, and the G20 report is right to worry about plutocratic capture of politics. And part of it is political economy: framing the world as suffering from an ‘inequality emergency’ creates a powerful justification for expanding the fiscal and regulatory reach of the state. The report’s headline recommendations – more progressive taxation, new global wealth taxes, enlarged multilateral mandates, National Inequality Reduction Plans – all point towards a larger public sector.
I am not arguing against redistribution. A civilised society should ensure that everyone has a basic standard of living and a fair chance in life. South Africa already redistributes a very large share of national income through grants, free or subsidised education, health and other transfers, and there is a strong case for doing better on both poverty relief and mobility. My point is different. We should be honest that what we really care about is not the Gini, but whether those at the bottom are less poor and more mobile. Inequality is, at best, a noisy proxy for that; at worst, it can be a distraction that encourages policies which lower the Gini while doing little for the poor.
People do not experience a Gini coefficient. They experience poverty, or its absence, and the presence or absence of ladders to climb. If there is an emergency, it is that too many of those ladders are still missing.
A perspective I never knew I needed.
As a young person, I’ve noticed that suffering has been commodified on the internet, and it’s starting to seep into politics in many parts of the world.
The world now feels full of resentment-fuelled populist leaders who look backwards and downplay the progress we’ve made as a global civilisation. In many places, politics no longer seems forward-looking, and there’s a strong sense of desperation that is unfortunately shaping policy.
As someone who consumes mostly left-leaning media, it often feels easier to look around and simply blame “the system” rather than evaluate the whole situation with nuance. I'd happily take in simple platitudes and mantras about how "everything has gone to shit" and align myself with the personalities who say this, rather than engage with the longer, more complex and challenging solutions to why "everything has gone to shit".
I really appreciate this perspective, and I hope we see more nuanced, research-rich contributions on problems like inequality, like this, in public office, the media, and government.
Amazing read!
I am reminded of Goodhart's law: once a metric becomes a target, it ceases to be a good metric.