

Two point one
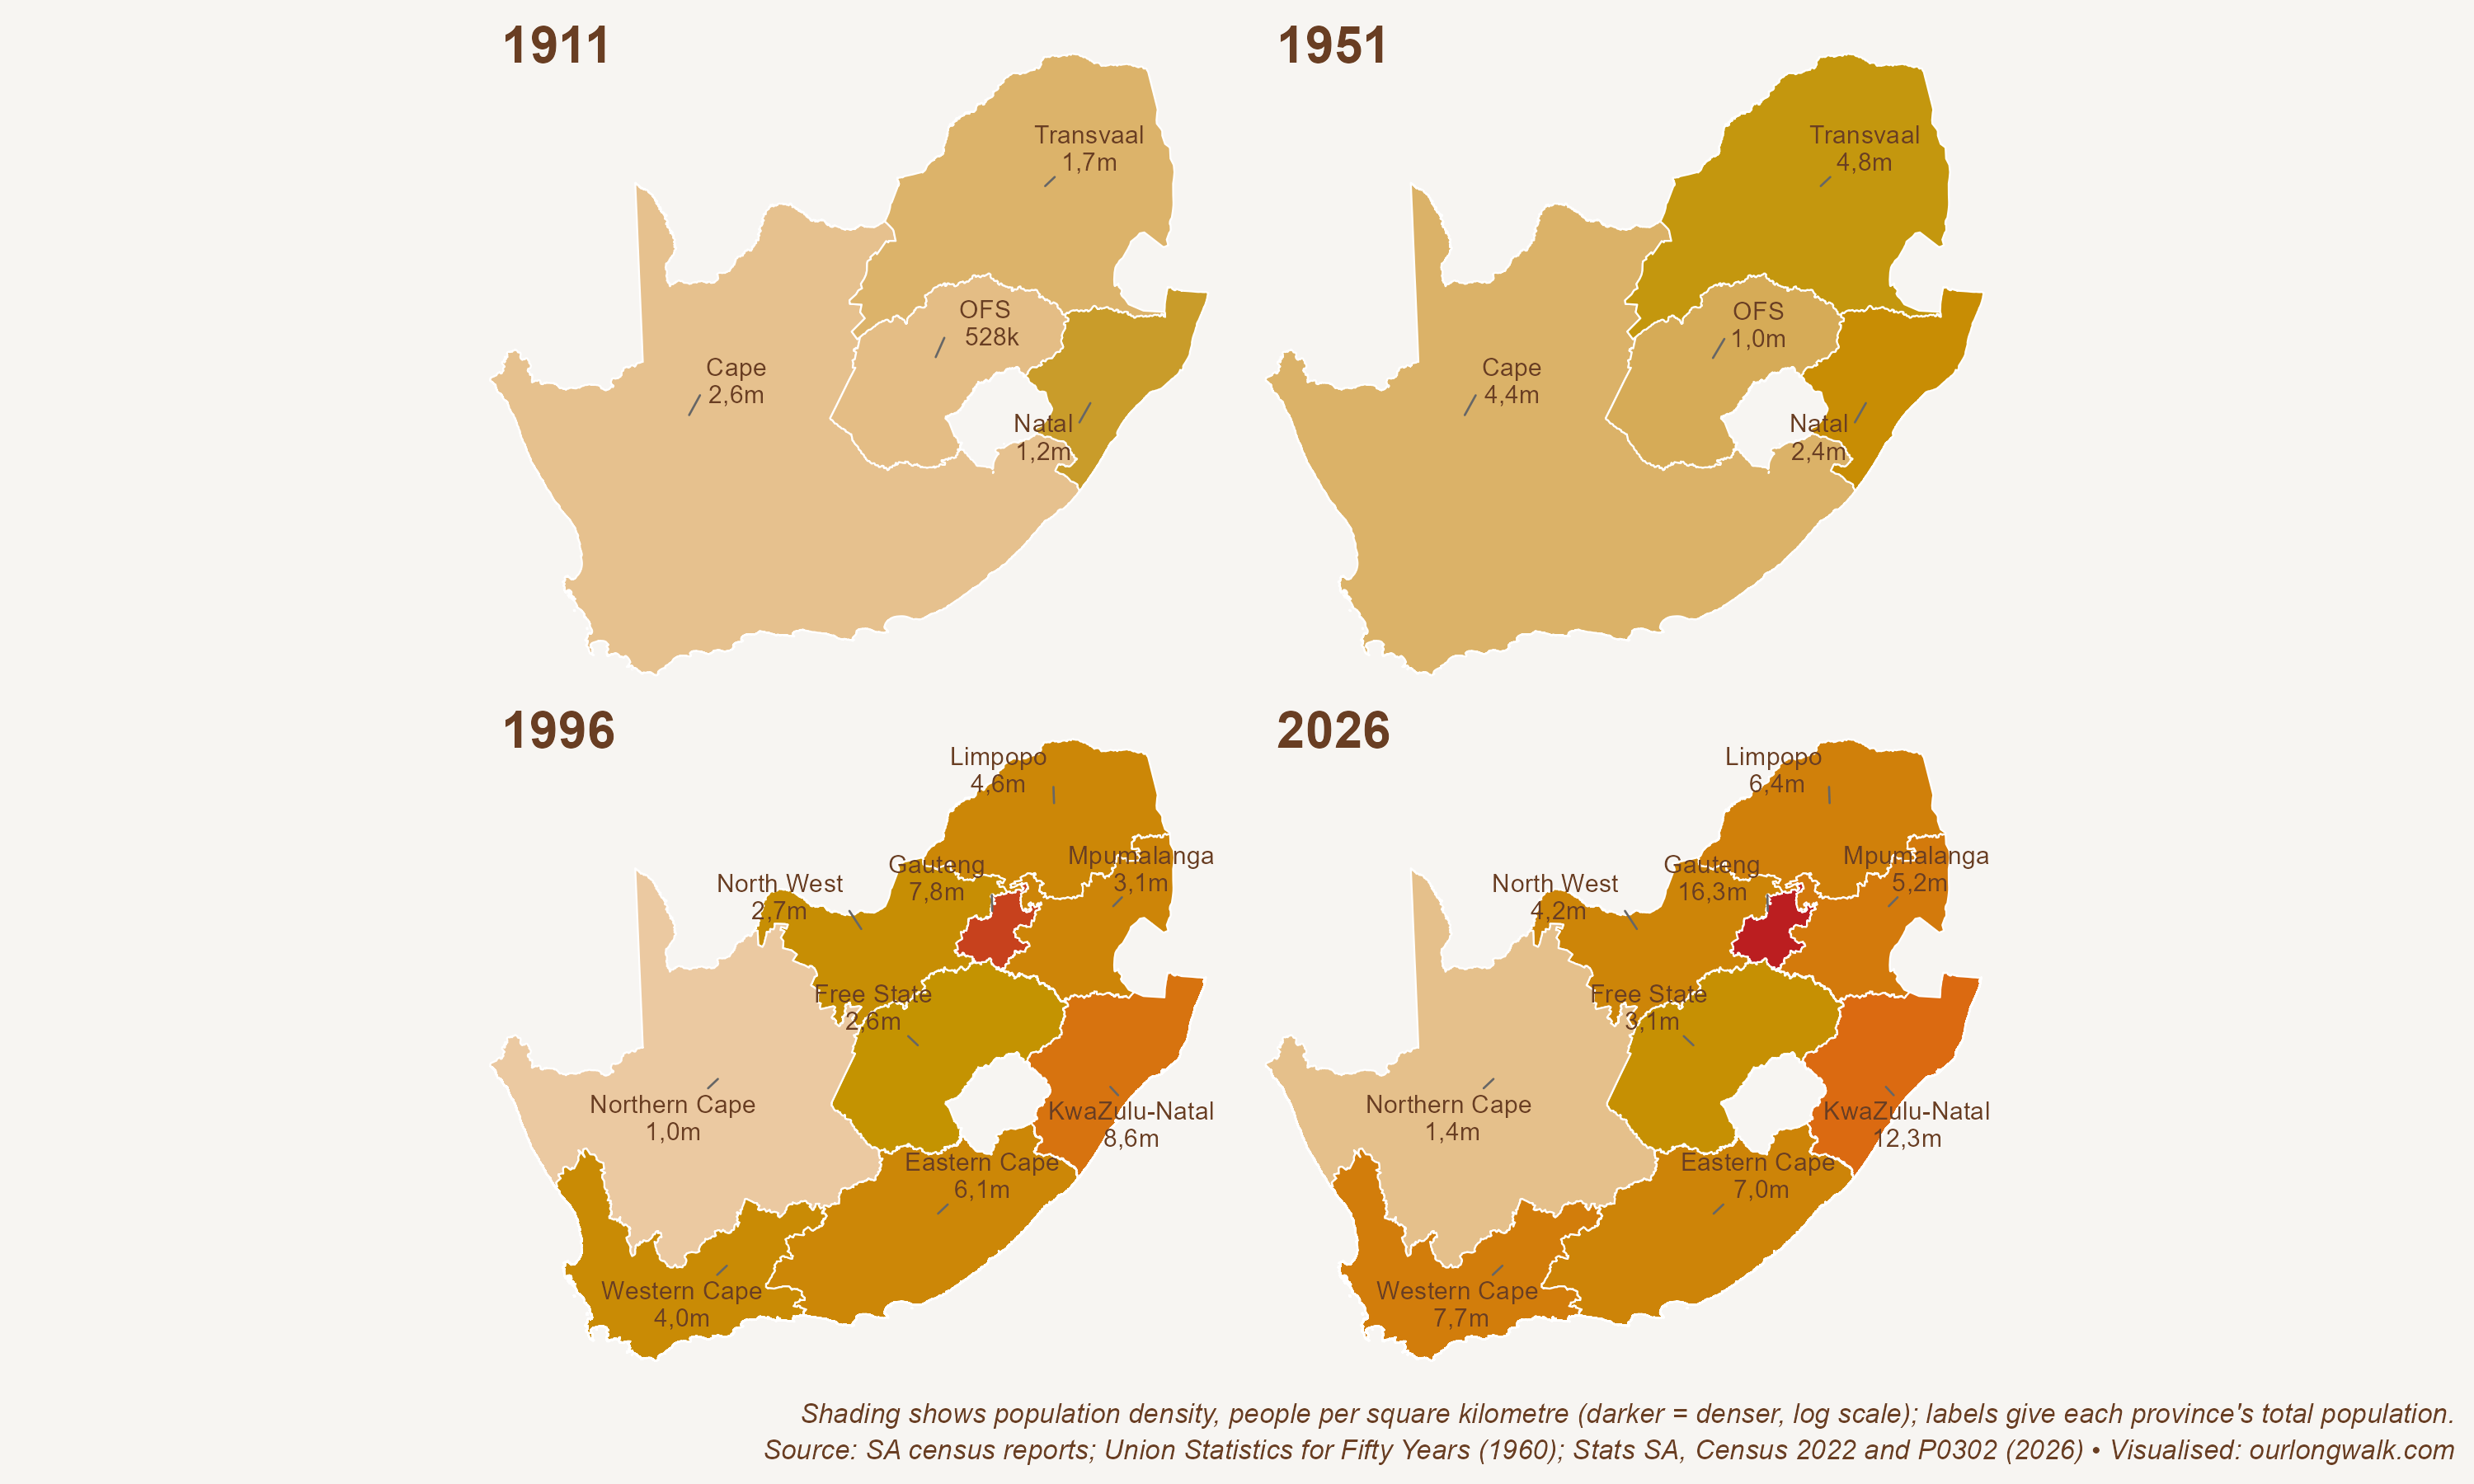
A hundred and sixty years of counting South Africans – and the line is levelling off.

On the night of Sunday 7 March 1875, every household in the Cape Colony had to account for itself. The enumerators counted 720 984 people – 369 628 men and 351 356 women. Most were asleep in houses and huts; 4 666 were in tents and wagons, and 1 673 aboard ships lying in the bays. The clerks then spent the better part of two years adding it up.
Last Thursday, Statistics South Africa published its mid-year estimates for 2026. There are now 63 522 380 of us. That is the number reported in the newspapers. The number that will matter more is 2,12.
That is South Africa’s total fertility rate – the children the average woman will bear in her lifetime. Demographers use 2,1 as the replacement rate, the level at which one generation exactly replaces the one before it, with a small margin for those who do not survive to have children of their own. Because our child mortality is still higher than a rich country’s, our true replacement level sits a fraction above 2,1. Which means South Africa may already have slipped below it.
You can see the consequence in the age structure. For five years now the number of South Africans under fifteen has been shrinking in absolute terms: this year there are 0,34 per cent fewer children in the country than last year, while the population over sixty grows at 2,66 per cent. The number of children last fell in the early 2000s, at the height of the AIDS pandemic. This time the arithmetic runs the other way: fewer are being born.
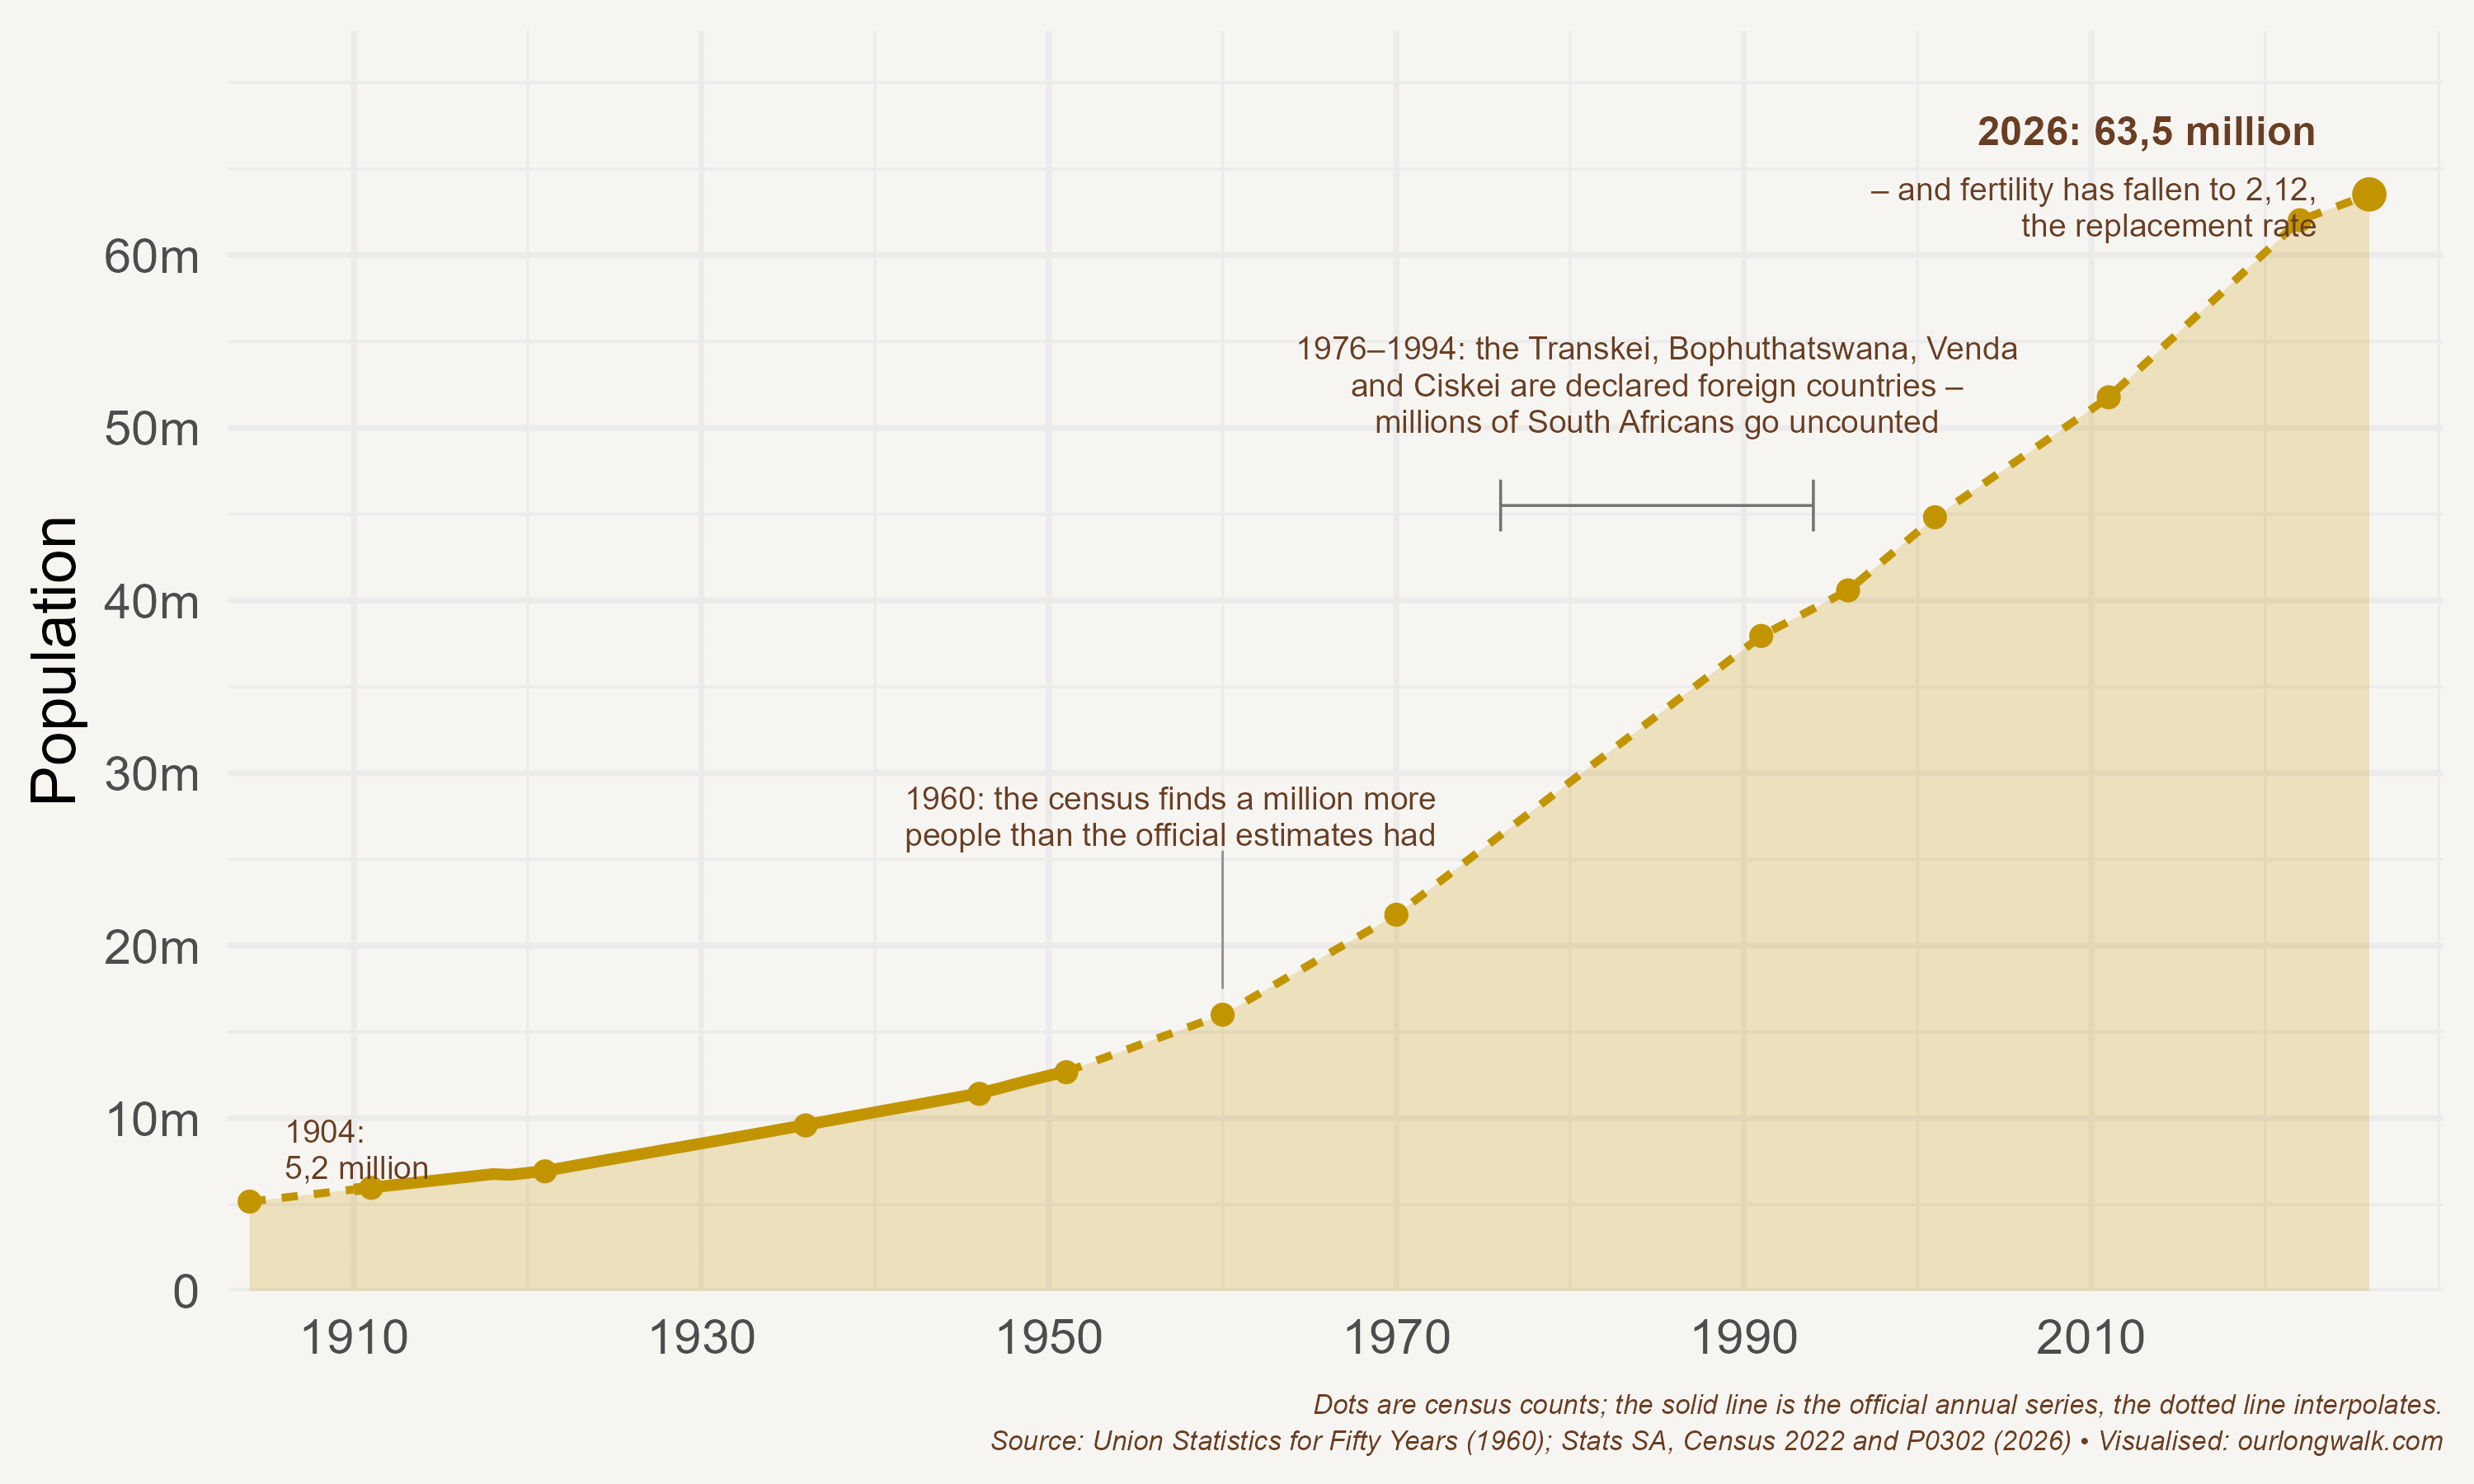
Or let’s put it another way: On 17 April 1904, six years before the Union existed, the four colonies that would become South Africa each held a census on the same day. Together they counted 5 174 827 people. Every count since has been bigger. The line survived two world wars, the Depression, and a century of governments moving people around the map like furniture.
It fell exactly once. Between mid-1918 and mid-1919 the official estimate dropped from 6 769 000 to 6 727 000 – some forty thousand people – as the Spanish influenza came through the ports and the mine compounds. One year in a hundred and twenty.
The line has its embarrassments too. In 1960 the census found roughly a million more people than the official estimates had allowed for: the statisticians had simply lost track of how many Africans there were. And between 1976 and 1994 the state carved the Transkei, Bophuthatswana, Venda and Ciskei out of the country, declared them foreign, and stopped counting their inhabitants as South African. On census day in 1991 that came to 6,75 million people – more than the whole population of the Union in 1911. To be counted is to count, and for eighteen years millions were deliberately subtracted.
The Cape tells the same story over a longer period.
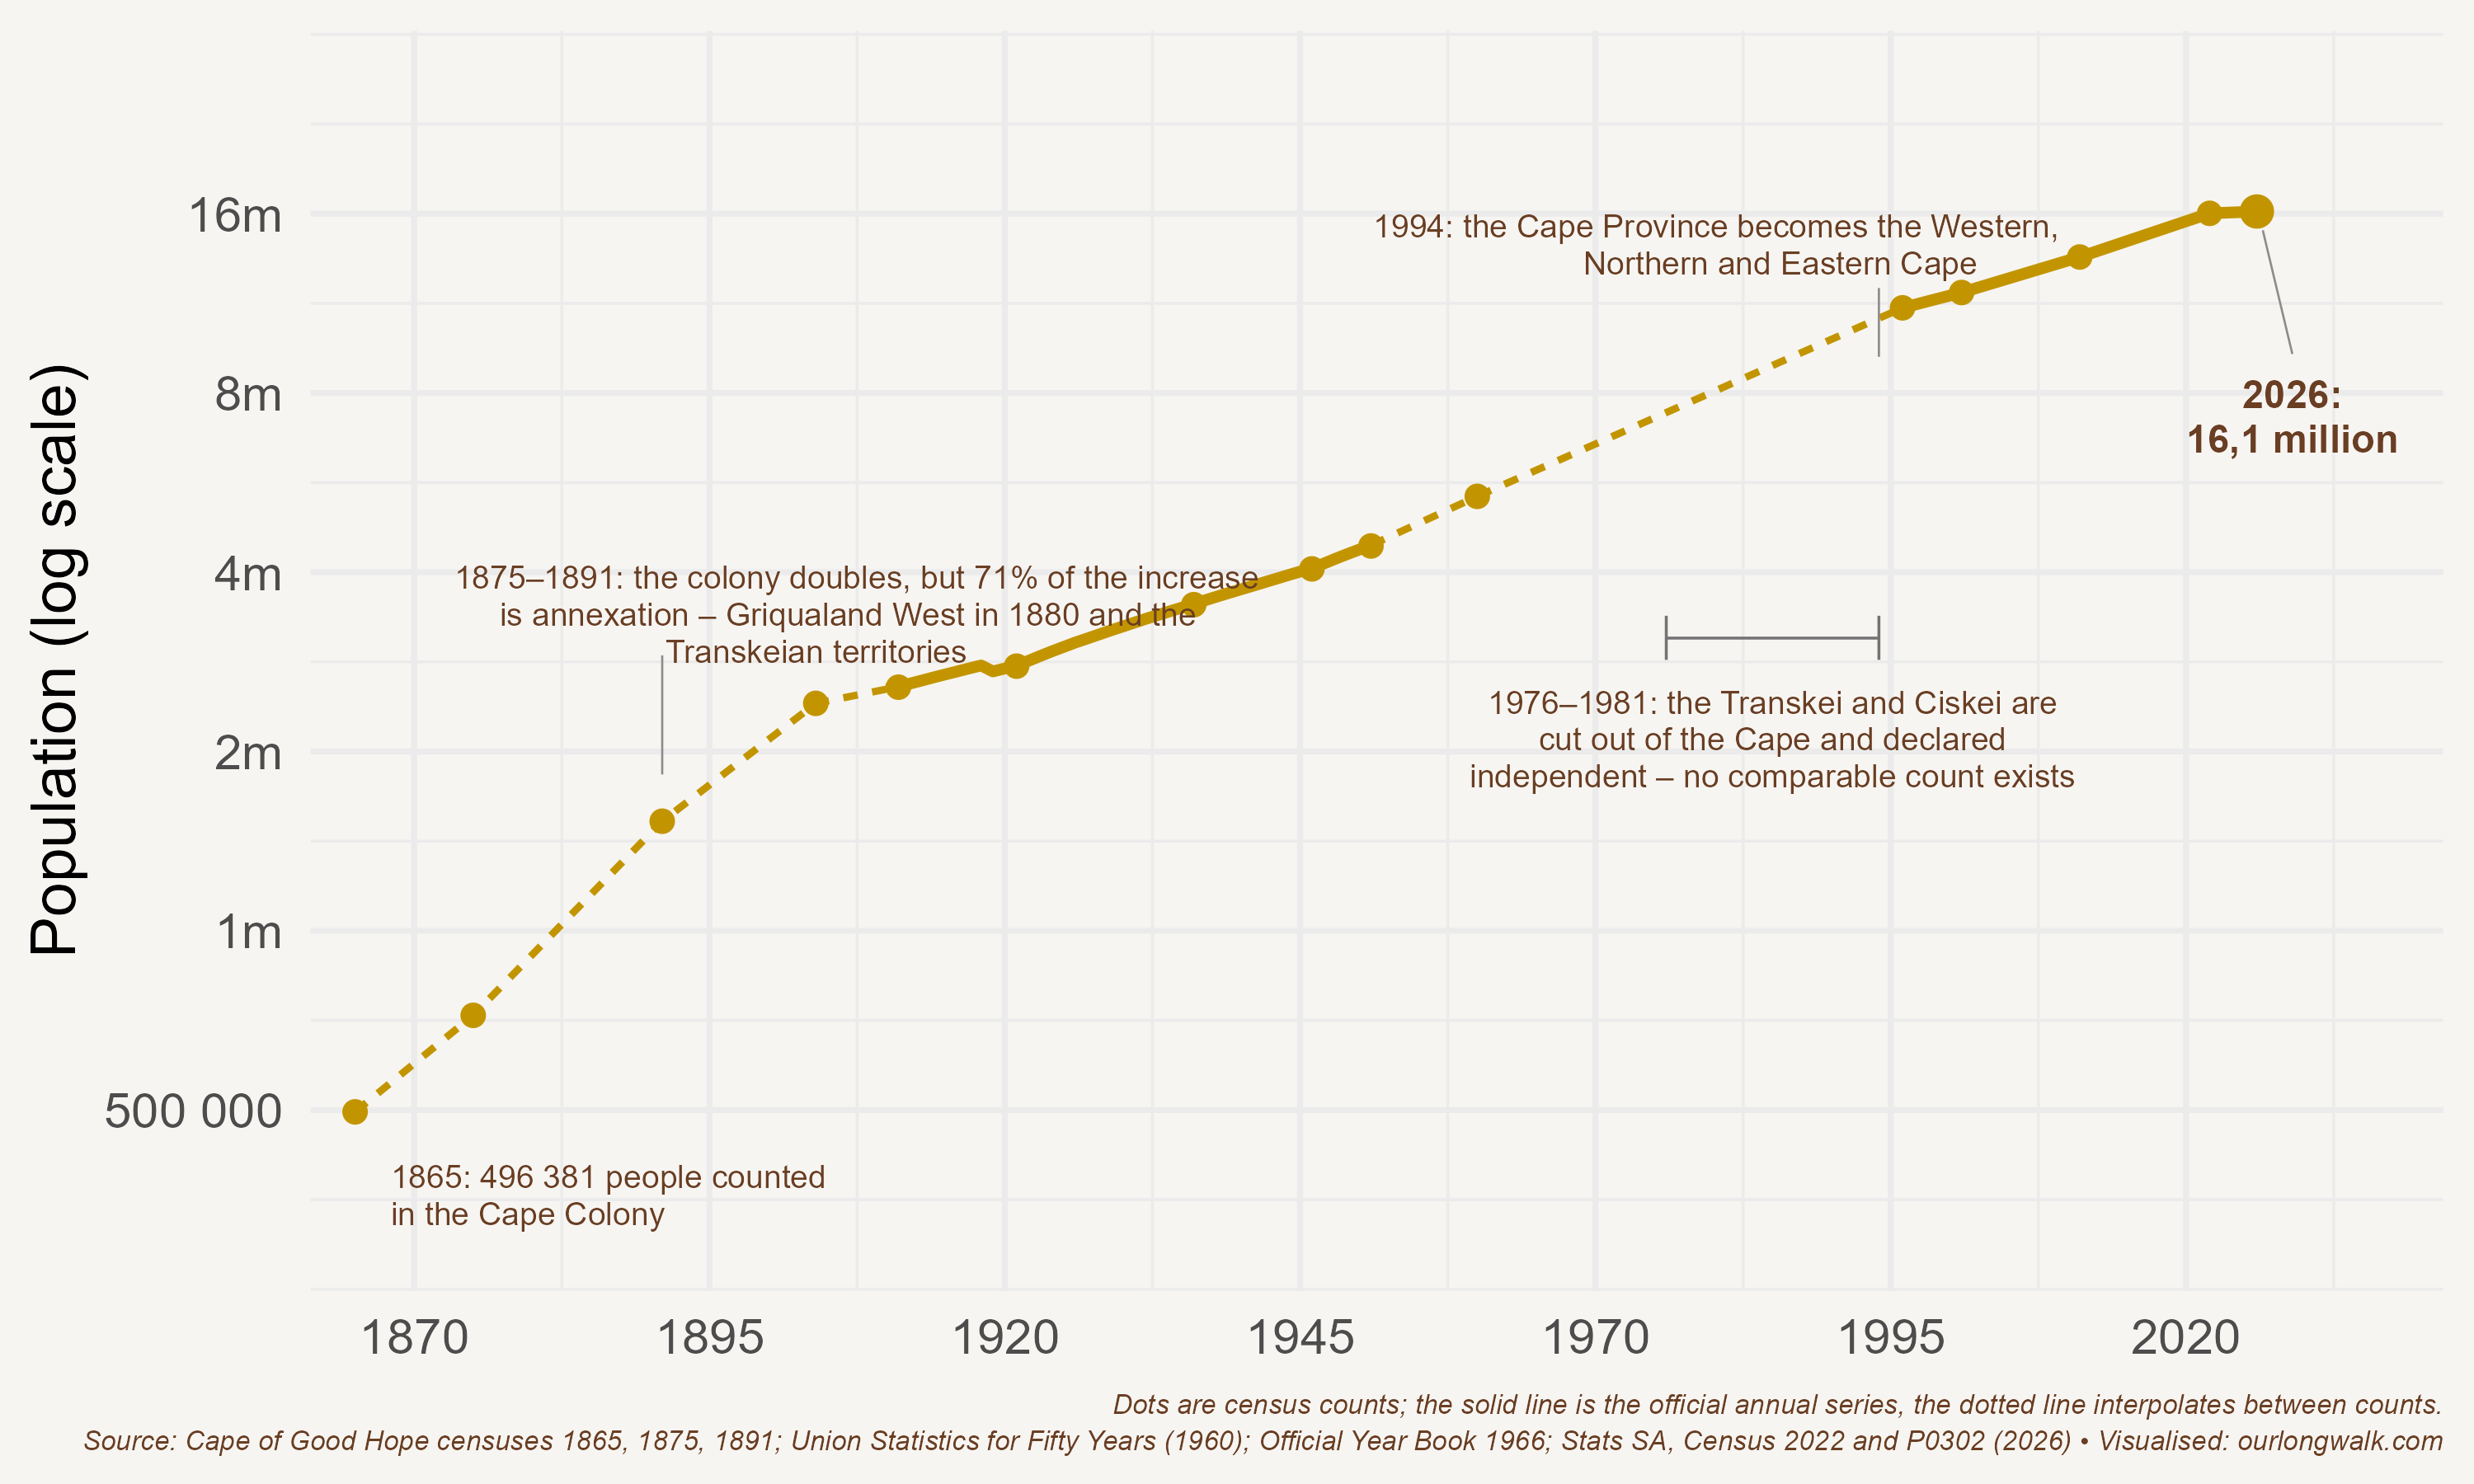
In 1865 the Cape Colony counted 496 381 people. Today the Western, Northern and Eastern Cape together hold 16,1 million – more than thirty-two times as many. Much of the early leap came from annexation: British Kaffraria after 1865, Griqualand West in 1880, the Transkeian territories over the following decades. The rest is people.
Here is the part that gets lost in the headline: South Africa’s population is still growing. What has changed is the reason: South Africans are staying alive longer.
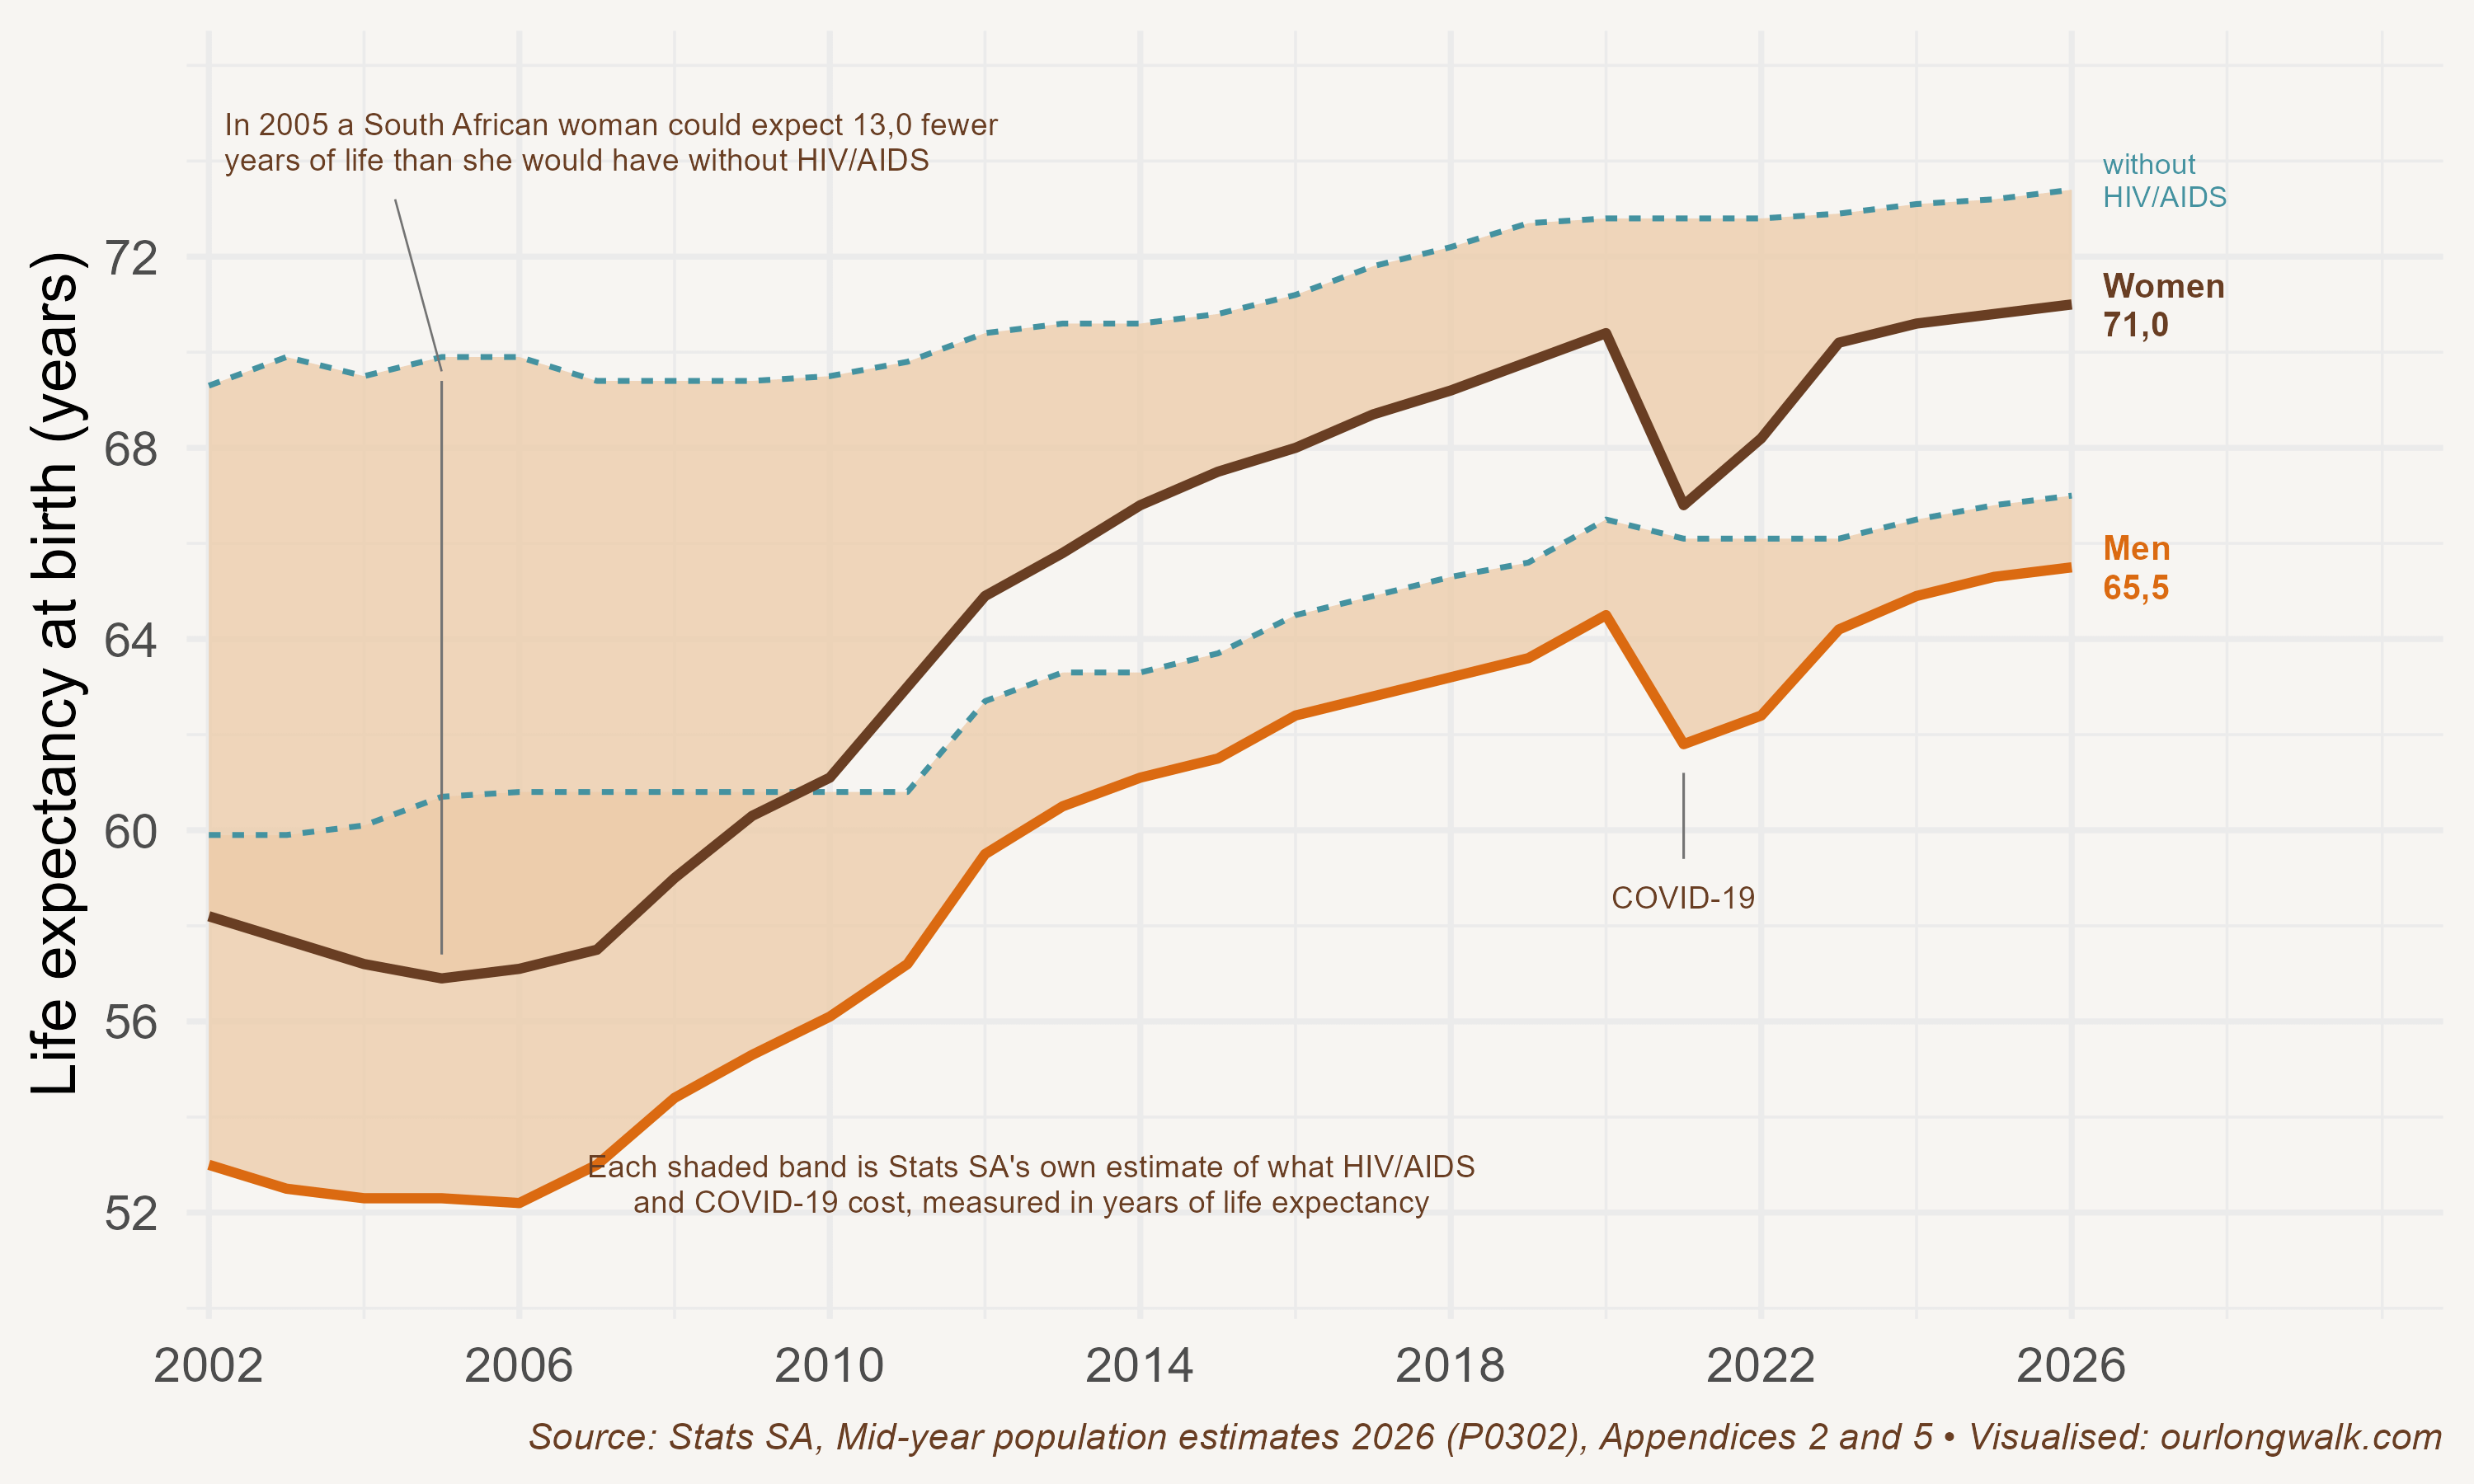
In 2002, 59,9 of every thousand babies born here died before their first birthday; today it is 23,7. Life expectancy at birth sank to 54,7 years in 2005, at the worst of the AIDS pandemic. StatsSA’s own counterfactual is the cruellest line in the release: without HIV, a South African woman in that year could have expected thirteen more years of life than she got. Then antiretrovirals arrived at scale and the line turned. Covid-19 took three years off it again in 2021 – deaths jumped by 29 per cent in twelve months – and then it recovered. Life expectancy is now 68,3 years, the highest Stats SA has ever recorded: 65,5 for men, 71,0 for women. Nearly eight million South Africans live with HIV, and this country runs the largest treatment programme in the world. That programme is a large part of why the graph still climbs.
So the growth is real, but the engine has been swapped out underneath it. Births peaked in 2008 at 1 198 764 and have fallen to 1 072 842. The birth rate, at 17 per thousand, is the lowest in the series. What keeps the total rising is that the people already here are not dying.
Fertility is not falling evenly, though. Gauteng’s fertility rate is 1,74. The Western Cape’s is 1,77. Both are well below replacement; demographically, they are living in the country’s future. Limpopo sits at 2,86 and the Eastern Cape at 2,62, and the Eastern Cape loses people to the other two in every window Stats SA measures: a net 295 374 in the current one, 171 525 of them to the Western Cape alone. So a province can be young and old at once: the Eastern Cape has the second-highest share of children in the country and the highest share of over-sixties, because the people in between have left.
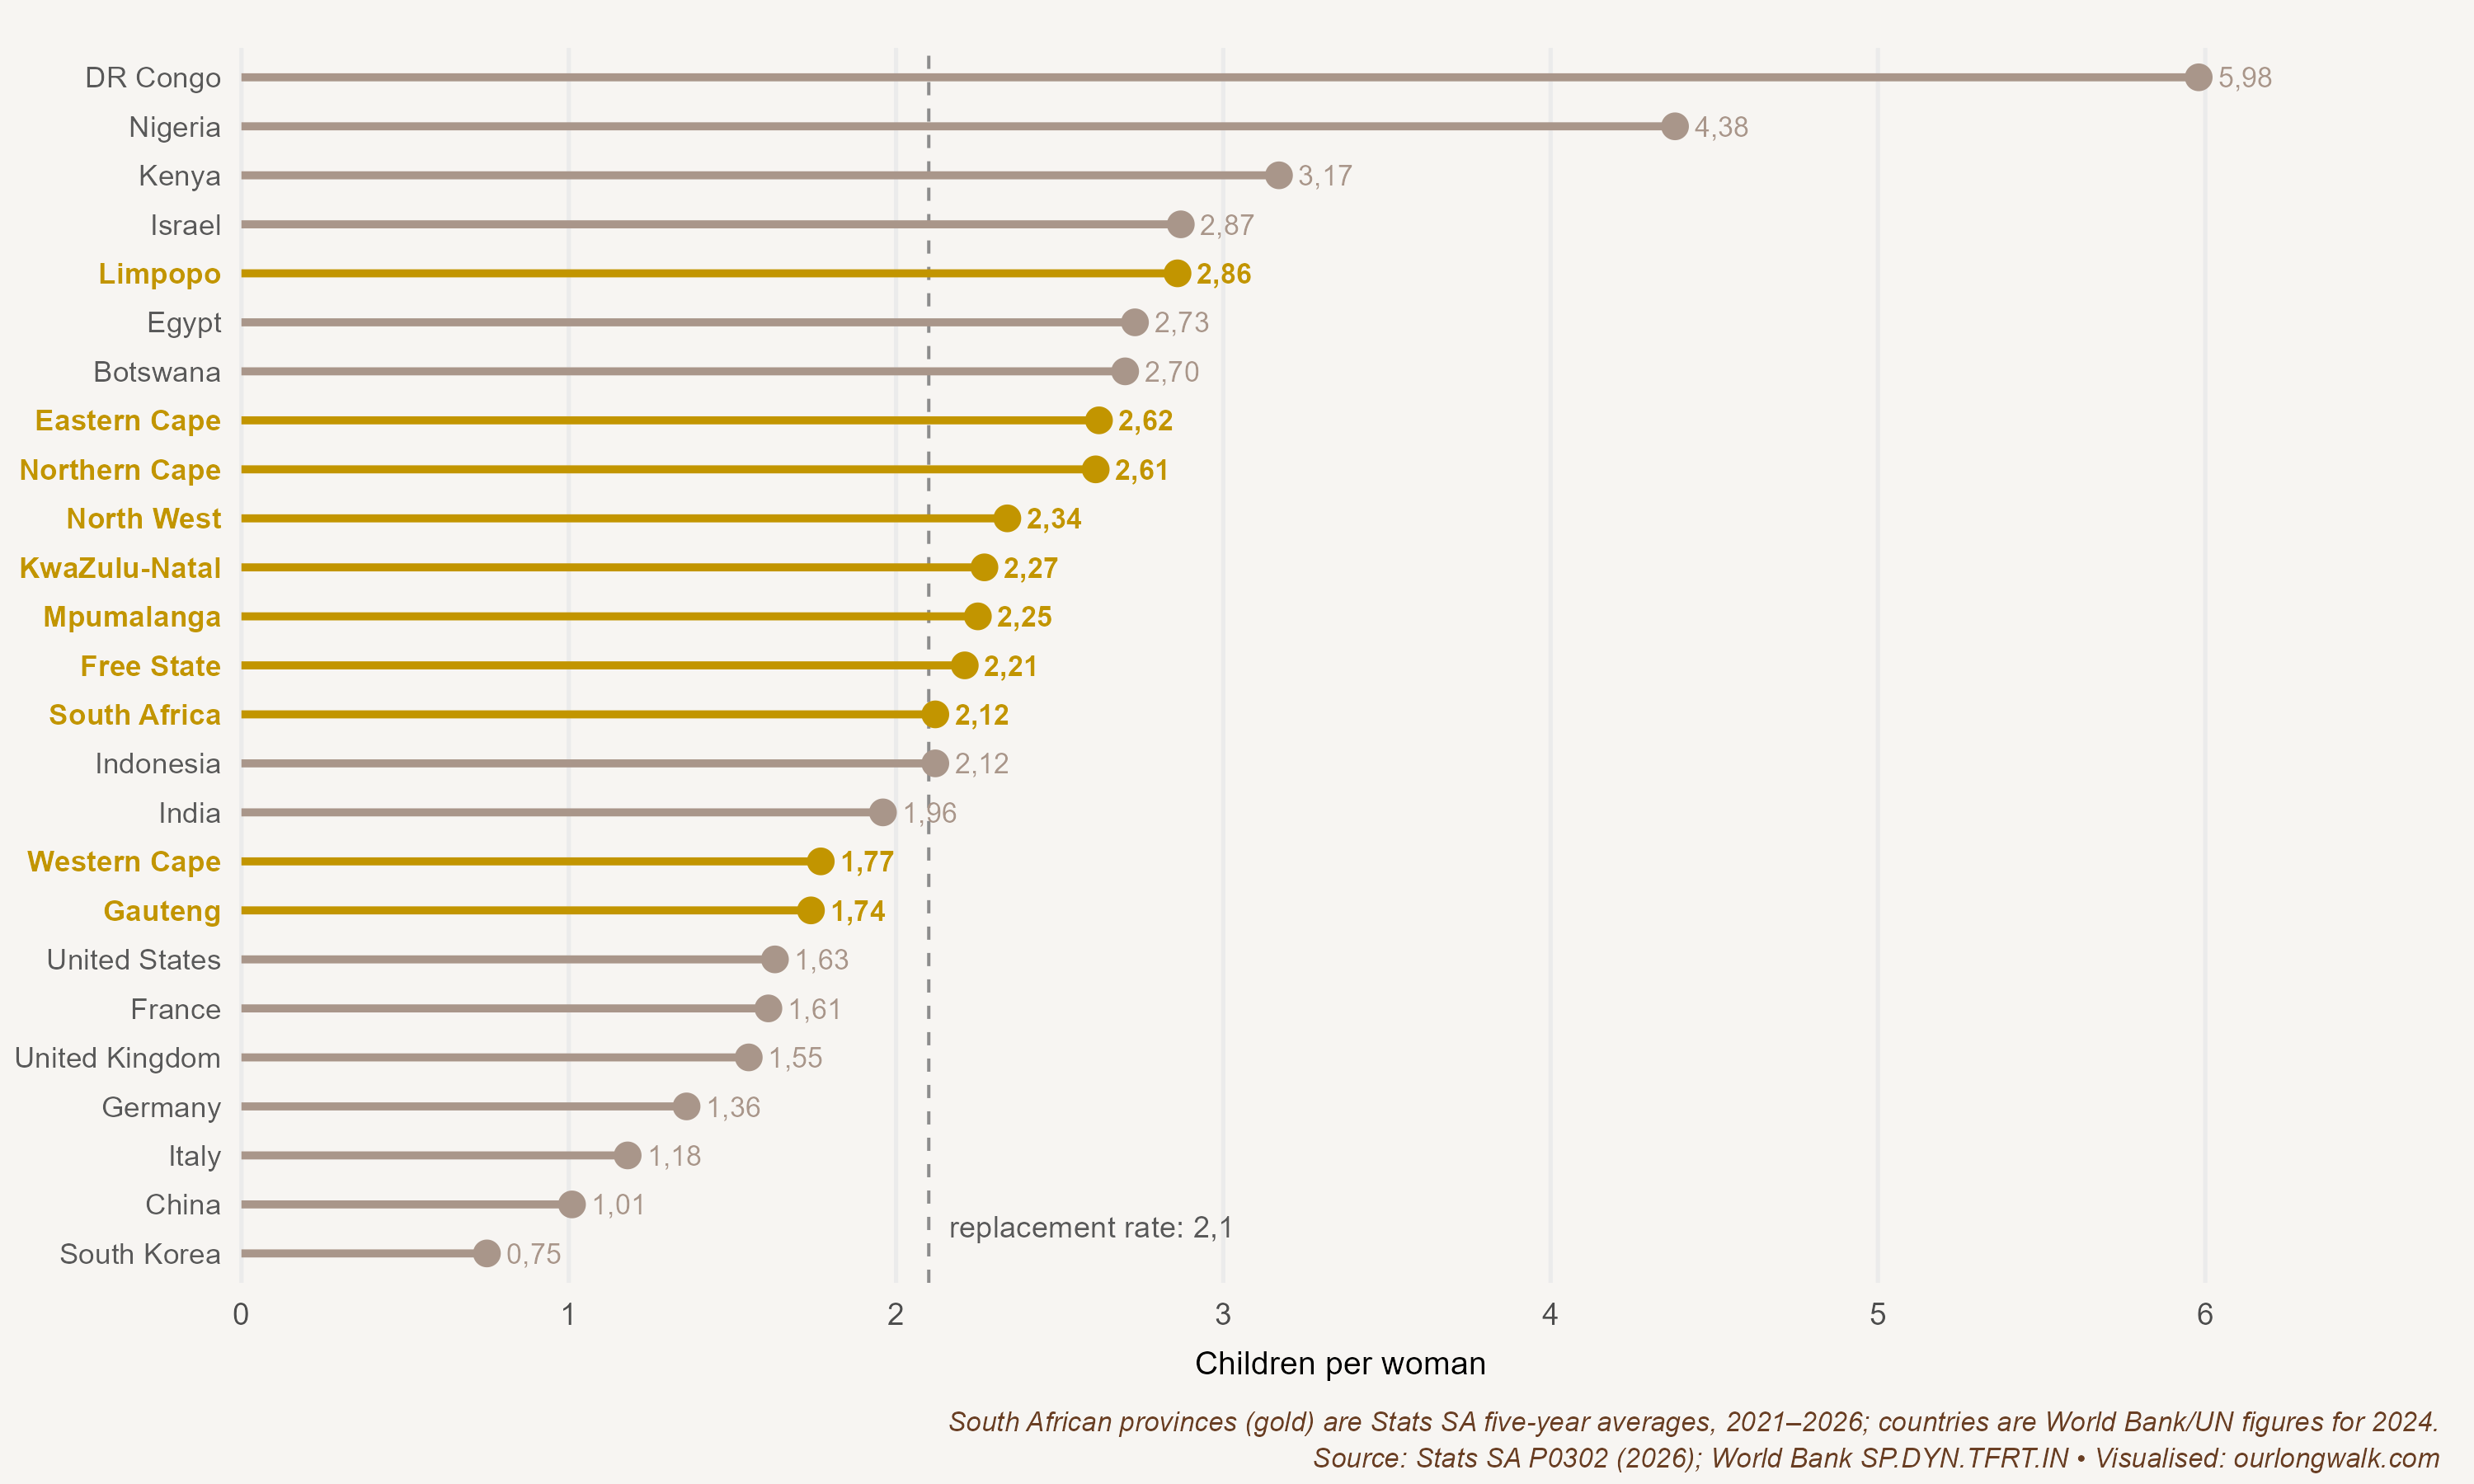
The gap is easier to see on the world ladder. Gauteng and the Western Cape have rich-country fertility: both sit just above the United States and France, and below India. Limpopo, at the other end, is almost exactly Israel – 2,86 against 2,87 – and above Egypt and Botswana. The Eastern Cape and Northern Cape are a shade under Botswana. South Africa as a whole lands on 2,12, which is Indonesia to the second decimal. One country, and a spread from American to Israeli fertility inside its own borders.
The composition has changed just as completely. In the 1904 census more than one in five people counted was classified white; today it is one in fourteen. In the 2022 census the median white South African was forty-five years old and the median black South African twenty-seven – two populations at different points on the same curve, in the same country. The South Africa of the past looked very different from this one. So will the South Africa of 2060.
The decline int the fertility rate is not, however, a white story. South Africans classified as white are 7,1 per cent of the population and, being older on average, only 5,4 per cent of women of childbearing age. Take them out of the count altogether and – even on the extreme assumption that their fertility is 1,0, below Italy’s – the national rate rises from 2,12 only to 2,18. Black African women are 84 per cent of all women of childbearing age, which means the national number essentially is their number: whatever every other group does, black African fertility has to sit somewhere between about 1,95 and 2,33.
Should anything be done about it? The honest answer is that nobody knows how to raise a birth rate, even if we wanted to.
In a new Journal of Economic Perspectives article, Michael Geruso and Dean Spears count the countries whose cohort fertility has ever dropped below 1,9. There are twenty-four. The number that have since climbed back to 2,1 is zero. The annual number of births worldwide peaked in 2012, and their conclusion is bracing: an era in which a great many humans exist may prove to be a historical anomaly with an end.
Why so little traction? In the same issue, Paula Gobbi, Anne Hannusch and Pauline Rossi give the most sensible answer I have read. Income, schooling and mortality explain about sixty per cent of the differences in fertility between countries – but barely seven per cent of the change within countries over fifty years. What is missing is family institutions: marriage systems, inheritance customs, the norms that set a floor and a ceiling on how many children a household can plausibly have. In monogamous societies economics framework accounts for more than eighty per cent of the fertility decline; in polygamous ones, under a quarter. Change the institutions and the numbers move: when Namibia improved widows’ inheritance rights in 2008, the birth rate fell by almost a quarter.
There is a South African footnote in their story. When British fertility collapsed in the late nineteenth century, it collapsed in step among British migrants in Canada, the United States – and here. The habit travelled with the people.
The one intervention that does seem to shift births is not money but time. Steven Davis, Nick Bloom and co-authors, in a new NBER Working Paper, find that couples in which both partners work from home at least one day a week end up with 0,32 more children, and attribute some 291 000 American births a year to the practice – more than public spending on childcare buys. Before we get excited: South Africa has one of the highest work-from-home rates in their thirty-eight-country sample, and in countries like ours that mostly means farming and small-scale production at or near the homestead, not a laptop on the kitchen table.
The clerks of 1875 thought they were measuring a colony at the beginning of something. They were. The 720 984 people they counted became 63,5 million. Their successors are now measuring something else: the top of the curve. The population will keep growing for decades yet, on momentum and on medicine. But somewhere in this year’s estimates is, in all likelihood, the last South African generation larger than the one before it.
Dankie Johan! Laat mens dink..
Johan, very interesting. Do you have any comments on migration? Particularly when there are economic gradients to neighboring countries?