


The story of Louis
My keynote at the European Historical Demography Conference


On Wednesday, 30 August, I gave a keynote address at the European Historical Demography Conference in Nijmegen, the Netherlands. Below is a shortened version of my speech. (Some of the figures have been removed to reduce the size of the post.)
Today, I will make the case for four challenges and opportunities. That 1) new tools have made untapped global demographic data more accessible than only a few years ago, 2) that this data enables historical demographers to tell the stories of those excluded from conventional archival sources, 3) that doing so allows us to bridge the gap between academia and the general public at a time of large societal divisions, and 4) that to continue to foster a deeper understanding of historical interactions we must bridge not only geographic but also disciplinary boundaries.
That is a mouthful, so to simplify – and to practice what I preach – I will tell you a story, the story of Louis.
In August 1687, a young man from the town of Livron in Dauphiné, France bid his father, mother, and sister farewell and set off on a journey. He would never see them again. Louis was around eighteen years old, an illiterate farm labourer, and hoped to find a new life, free from persecution that had become common in his home country.
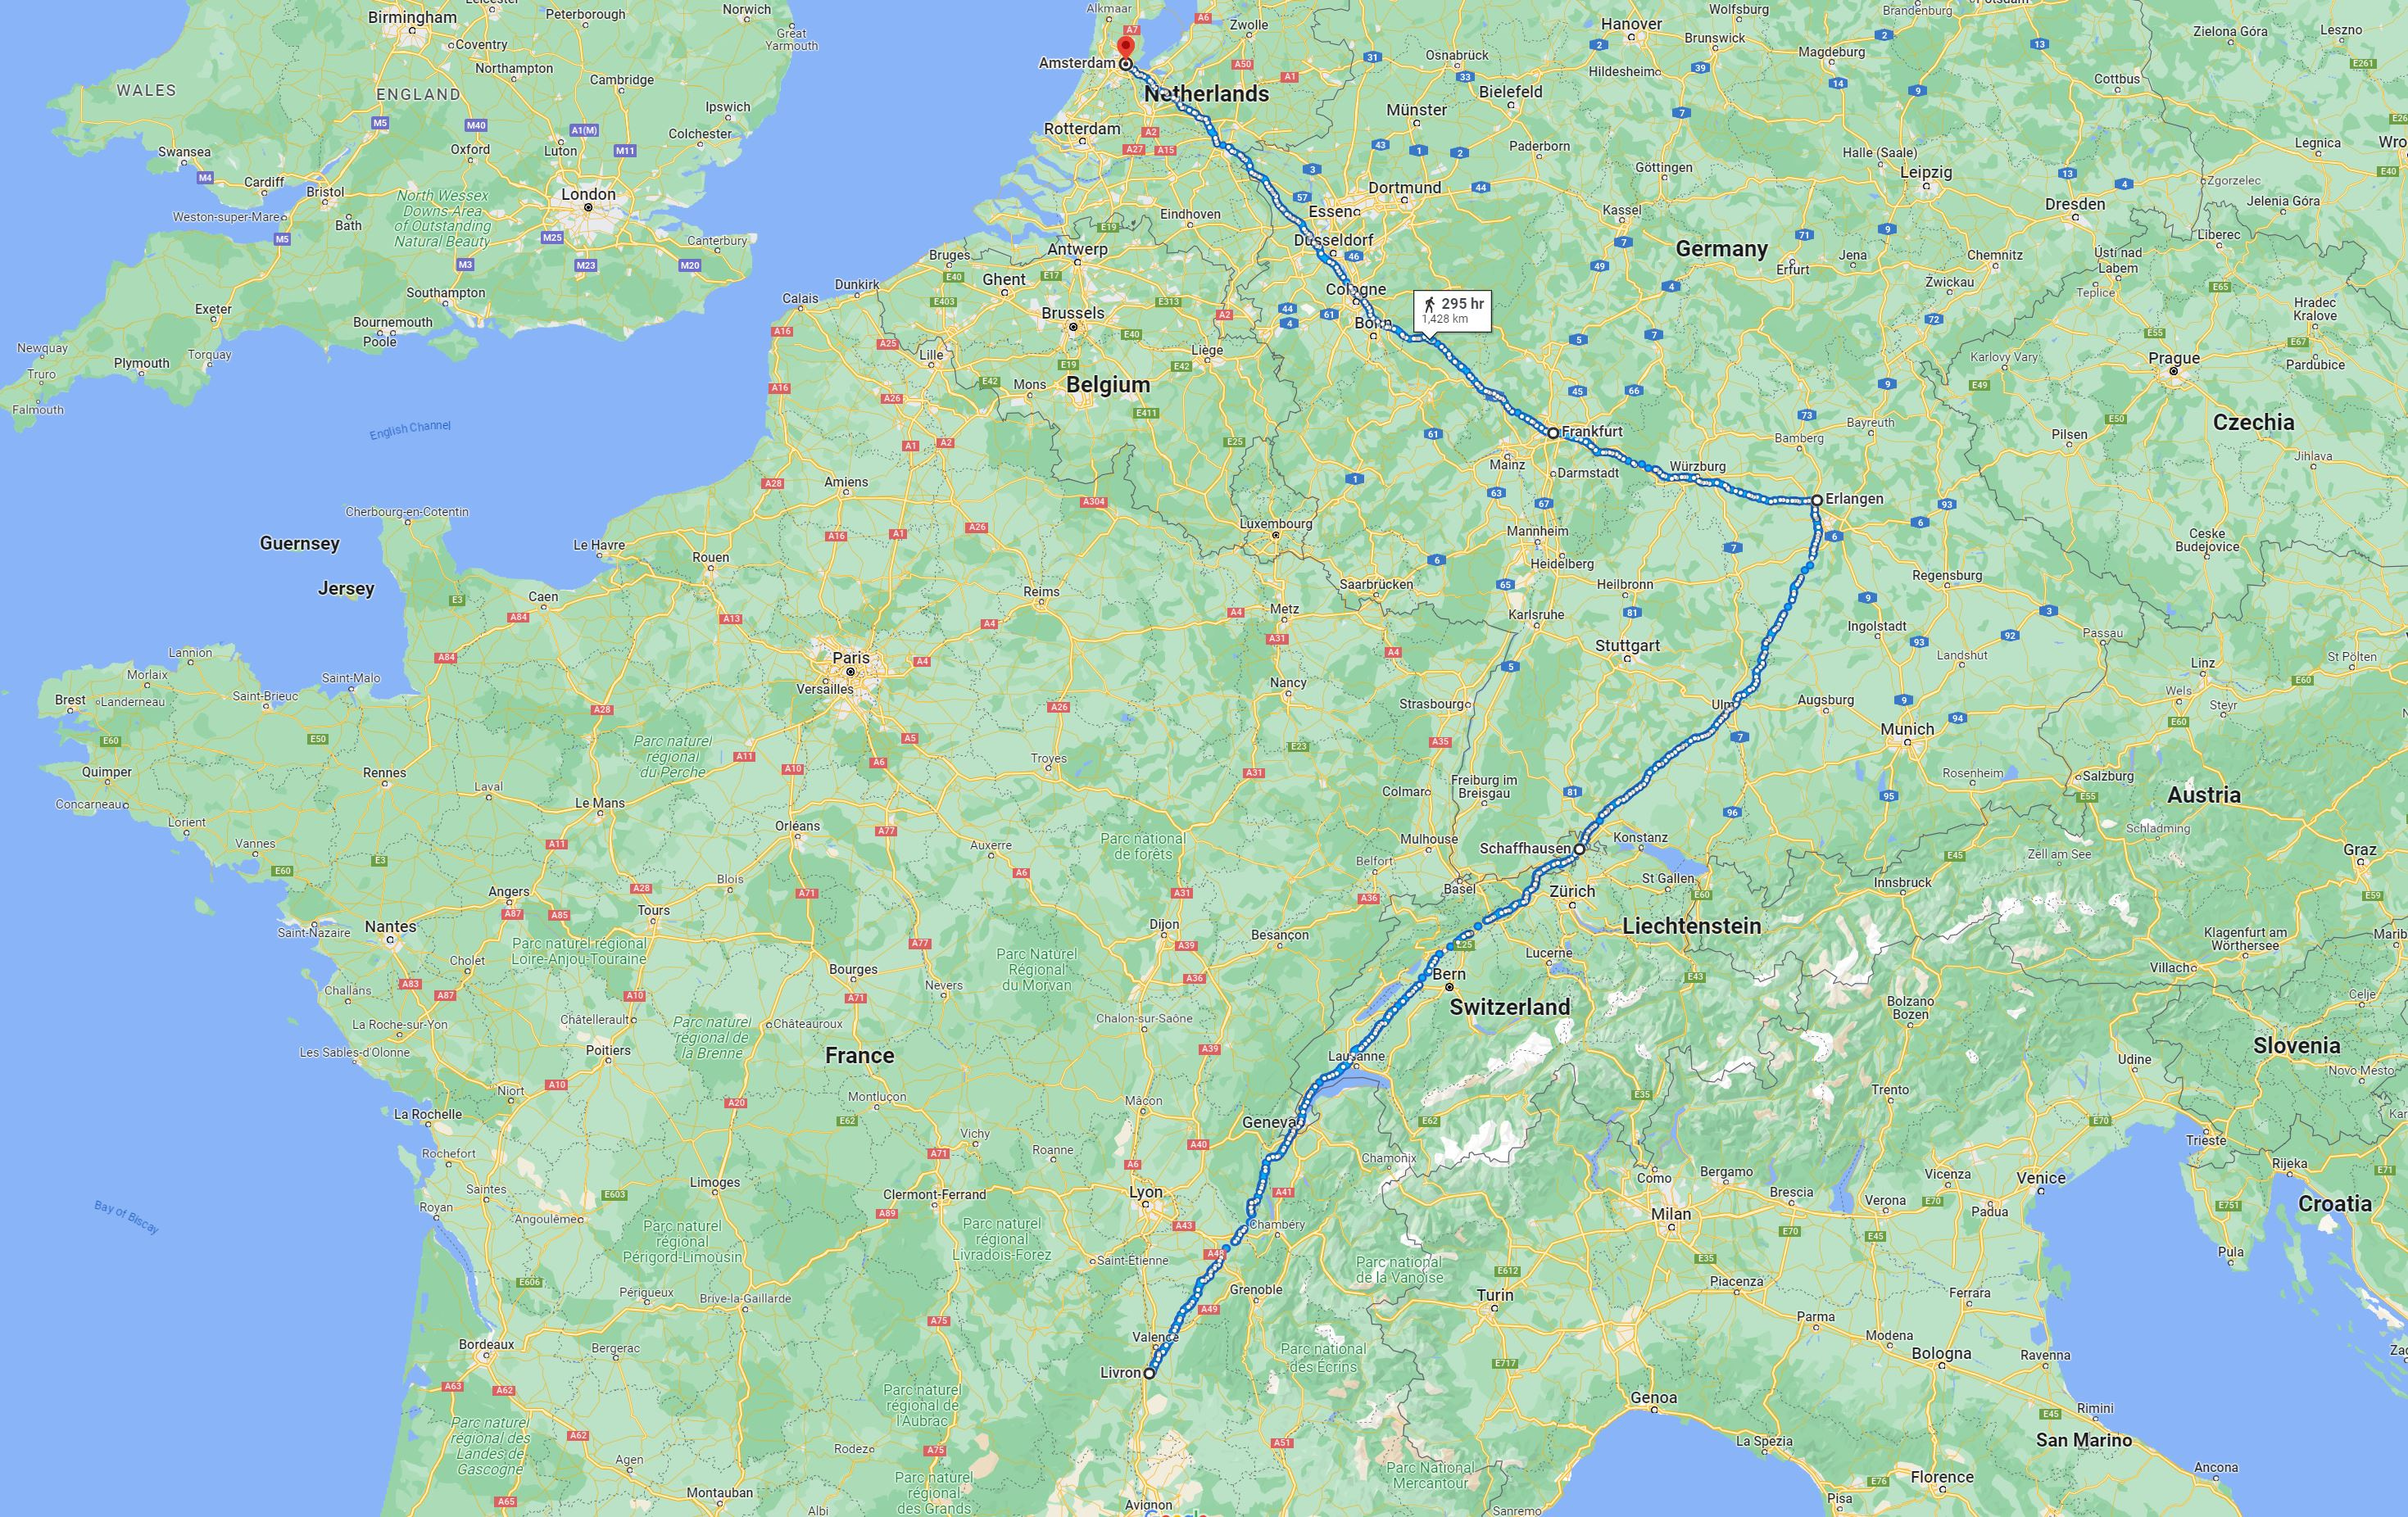
He arrived in Schaffhausen, today on the Swiss-German border around two months after starting out.[1] There, he received assistance from the Reform Church of Switzerland. We know this because of the mass transcription effort by the French historian Michelle Magdelaine, documenting the journeys of more than 25,000 Huguenots through Switzerland and Germany.
Louis aimed for Bavaria. Back in France, he had heard rumours about a better life in the principality of Erlangen, where the Margrave Christian Ernst had invited Huguenot refugees to bolster his region still suffering the devastation of the Thirty Years War. And on 30 October, three months after starting out, he finally arrived in Erlangen.
But he did not stay long. Instead, he set his sights on a new destination – the greatest city in the world: Amsterdam. He arrived in Frankfurt on the 6th of November after being convinced to shift course by a couple he had met along the way. Pierre Lombard and Marie Couteau were also Huguenots from his hometown, Livron. Pierre and Marie had also received assistance in Schaffhausen eight days after Louis, but the three of them arrived in Frankfurt together.
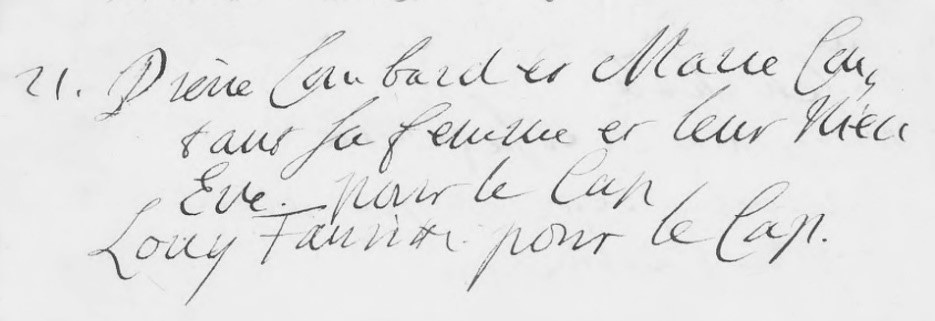
Another six weeks later, on the 21st of December, Pierre and Marie would be recorded in the records of the Walloon Church in Amsterdam. Their destination? The Cape of Good Hope at the southern tip of Africa. And at the bottom of the page, just below the names of Pierre, Marie and Eve, probably their daughter, another entry would record: Louy Fauritte pour le Cap.
And so, on the 6th of January 1688, Louis Faurite embarked on the VOC ship Borsenburg. After 127 days, the ship, with at least six Huguenot progenitor surnames, including the Lombards, arrived in Table Bay on 12 May 1688.
While we have been able to reconstruct the life of Louis from fragmentary evidence in Europe, at the Cape, a refreshment station established four decades earlier to service ships sailing from Europe to the East Indies, we would learn a lot more about Louis. We can do so because we have exceptionally rich and well-preserved records. We know from marriage and baptism records, for example, that the connection between Louis and the Lombards continued after they arrived at the Cape. Pierre Lombard was a witness to the baptism of Louis’s daughter Sarah and, some years later, his eldest son Pieter Lombard married Louis’ daughter Marthé. Louis also served as witness to the baptism of Petrus Lombard, the son of Pieter and Marthé. Petrus was the grandson of Louis Fourie and his friend Pierre Lombard.
But we have more than just baptism records. Because the Cape Colony was governed by a Company, we also have exceptionally rich agricultural records. Over the last decade, my team and I have transcribed these annual tax censuses.[2] The Cape of Good Hope Panel hopes to build the world’s longest multigenerational panel of agricultural production – over 180 years of annual censuses.
It has been neither easy nor cheap to digitise historical records; we've struggled to get permission from the Cape Archives, but have been aided by the Dutch National Archives' digitized duplicates, allowing us to continue our work even during Covid. Digitization, as I need not remind this audience, is crucial for accessibility, especially for scholars like us far from original sources, but it is often a luxury in a developing country with limited and dwindling funding. My team and I are immensely grateful for the generous support from international institutions, particularly Sweden’s Riksbanken that supports our Cape Panel work with Lund University.
Louis and the other Europeans who arrived in Table Bay did not find the Cape an empty land. The winter rainfall area of the Western and Southern Cape was inhabited by the indigenous Khoesan. One of their clans, the Gorinhaikona, lived in the shadow of Table Mountain. Its leader, Autshumao, was soon appointed by the Dutch East India Company as translator. He sent his twelve year old niece Krotoa, to work in the household of Jan van Riebeeck, the first commander of the Cape station.
In 1664, twelve years after the establishment of the settlement, Krotoa married Pieter van Meerhof, a Danish surgeon, becoming the first Khoesan to marry according to Christian custom. They had three children, but after her husband’s death, Krotoa suffered a personal decline and was ultimately banished to Robben Island, where she died in 1673. This is not the end of her legacy though. Her daughter, Pieternella, married Daniel Zaaijman, the Company gardener. Today, all South Africans with the surname Saayman can trace their ancestry to Krotoa.
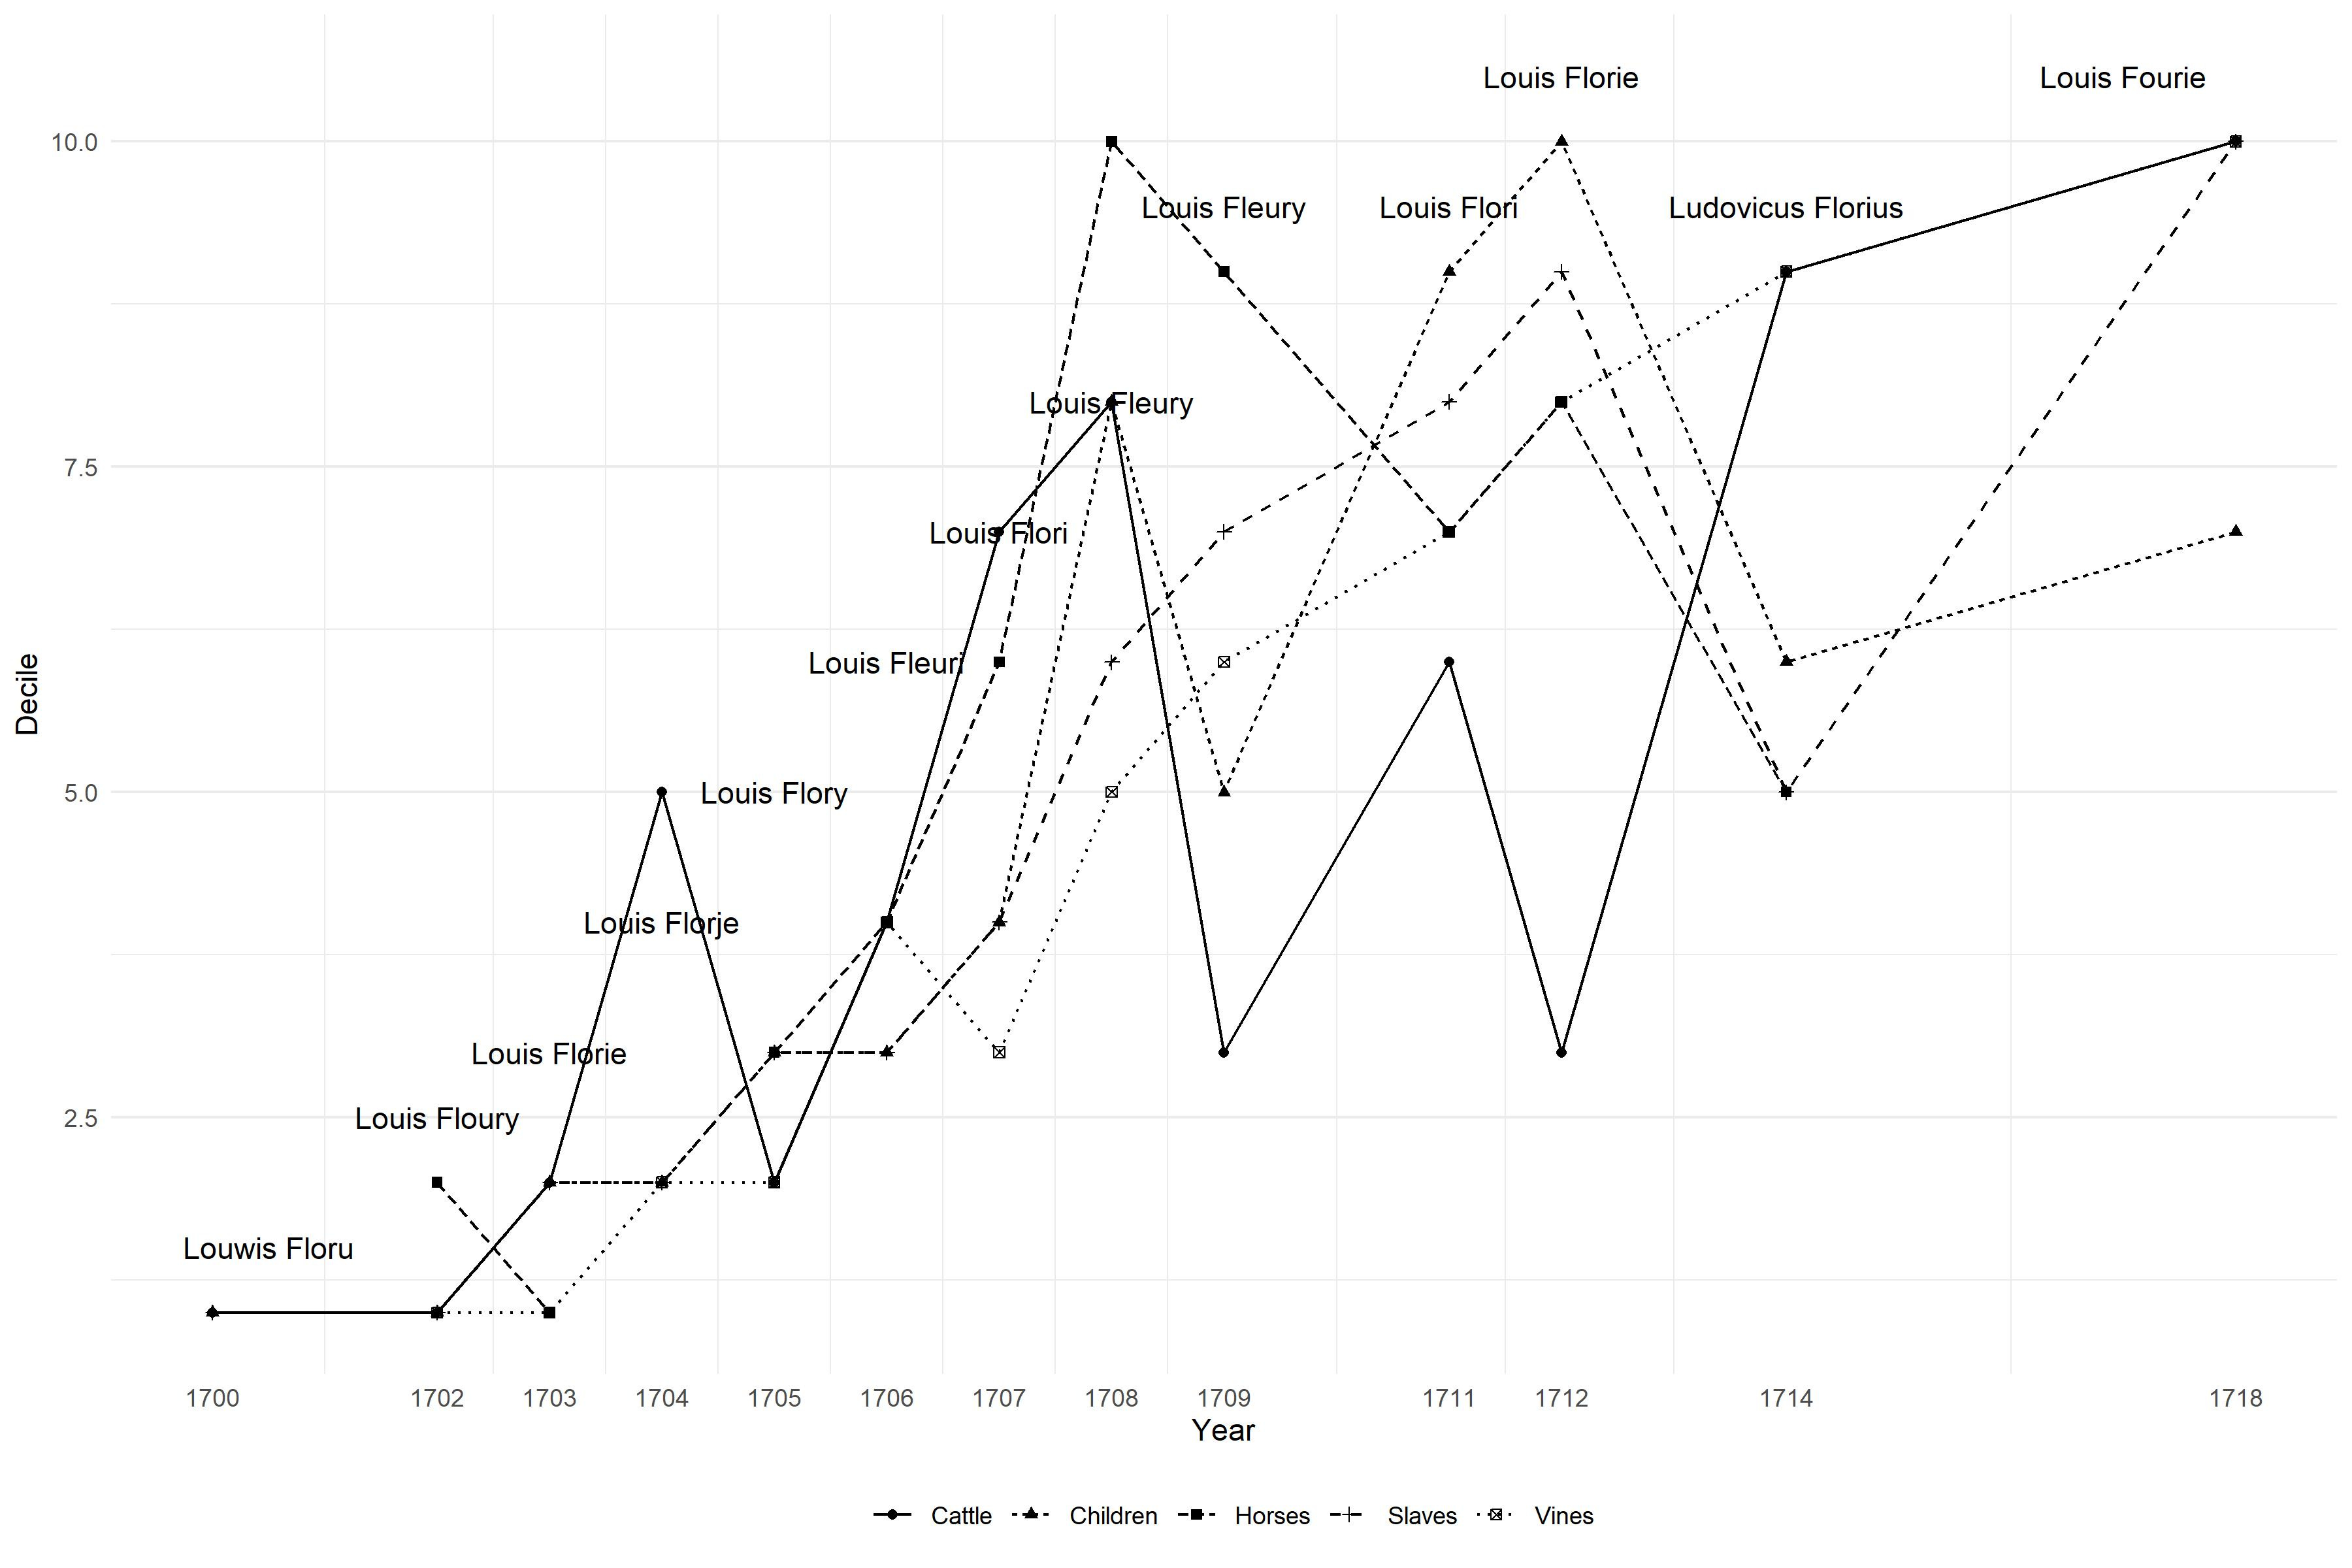
Louis appeared for the first time in the agricultural tax census in 1700. His name, as the figure indicates, is Louwis Floru. Faurite had become Floru. And it would vary considerably over the next few years, exposing another challenge for us: how would one design an algorithm that can successfully match Louis to himself, year after year, despite such spelling variations? In 1718, his name would finally settle down: Louis Fourie. It would remain like that until the end of his life, in 1750.
We can see Louis increasing the size of his household in the first two decades after he began farming. His first wife, Susanna Cordier, died in 1713, after giving birth to 9 children, but by 1718 he had remarried, this time to Anne Jourdan, another Huguenot, with whom he went on to have another 12 children. Louis did not die a rich man; in fact, his wealth was almost exactly the average of all probates for 1750. But because many of his male children survived infancy, he would ultimately have 99 grandchildren, more than double the average that Jeanne Cilliers and Martine Mariotti have found for Cape settlers.[3]
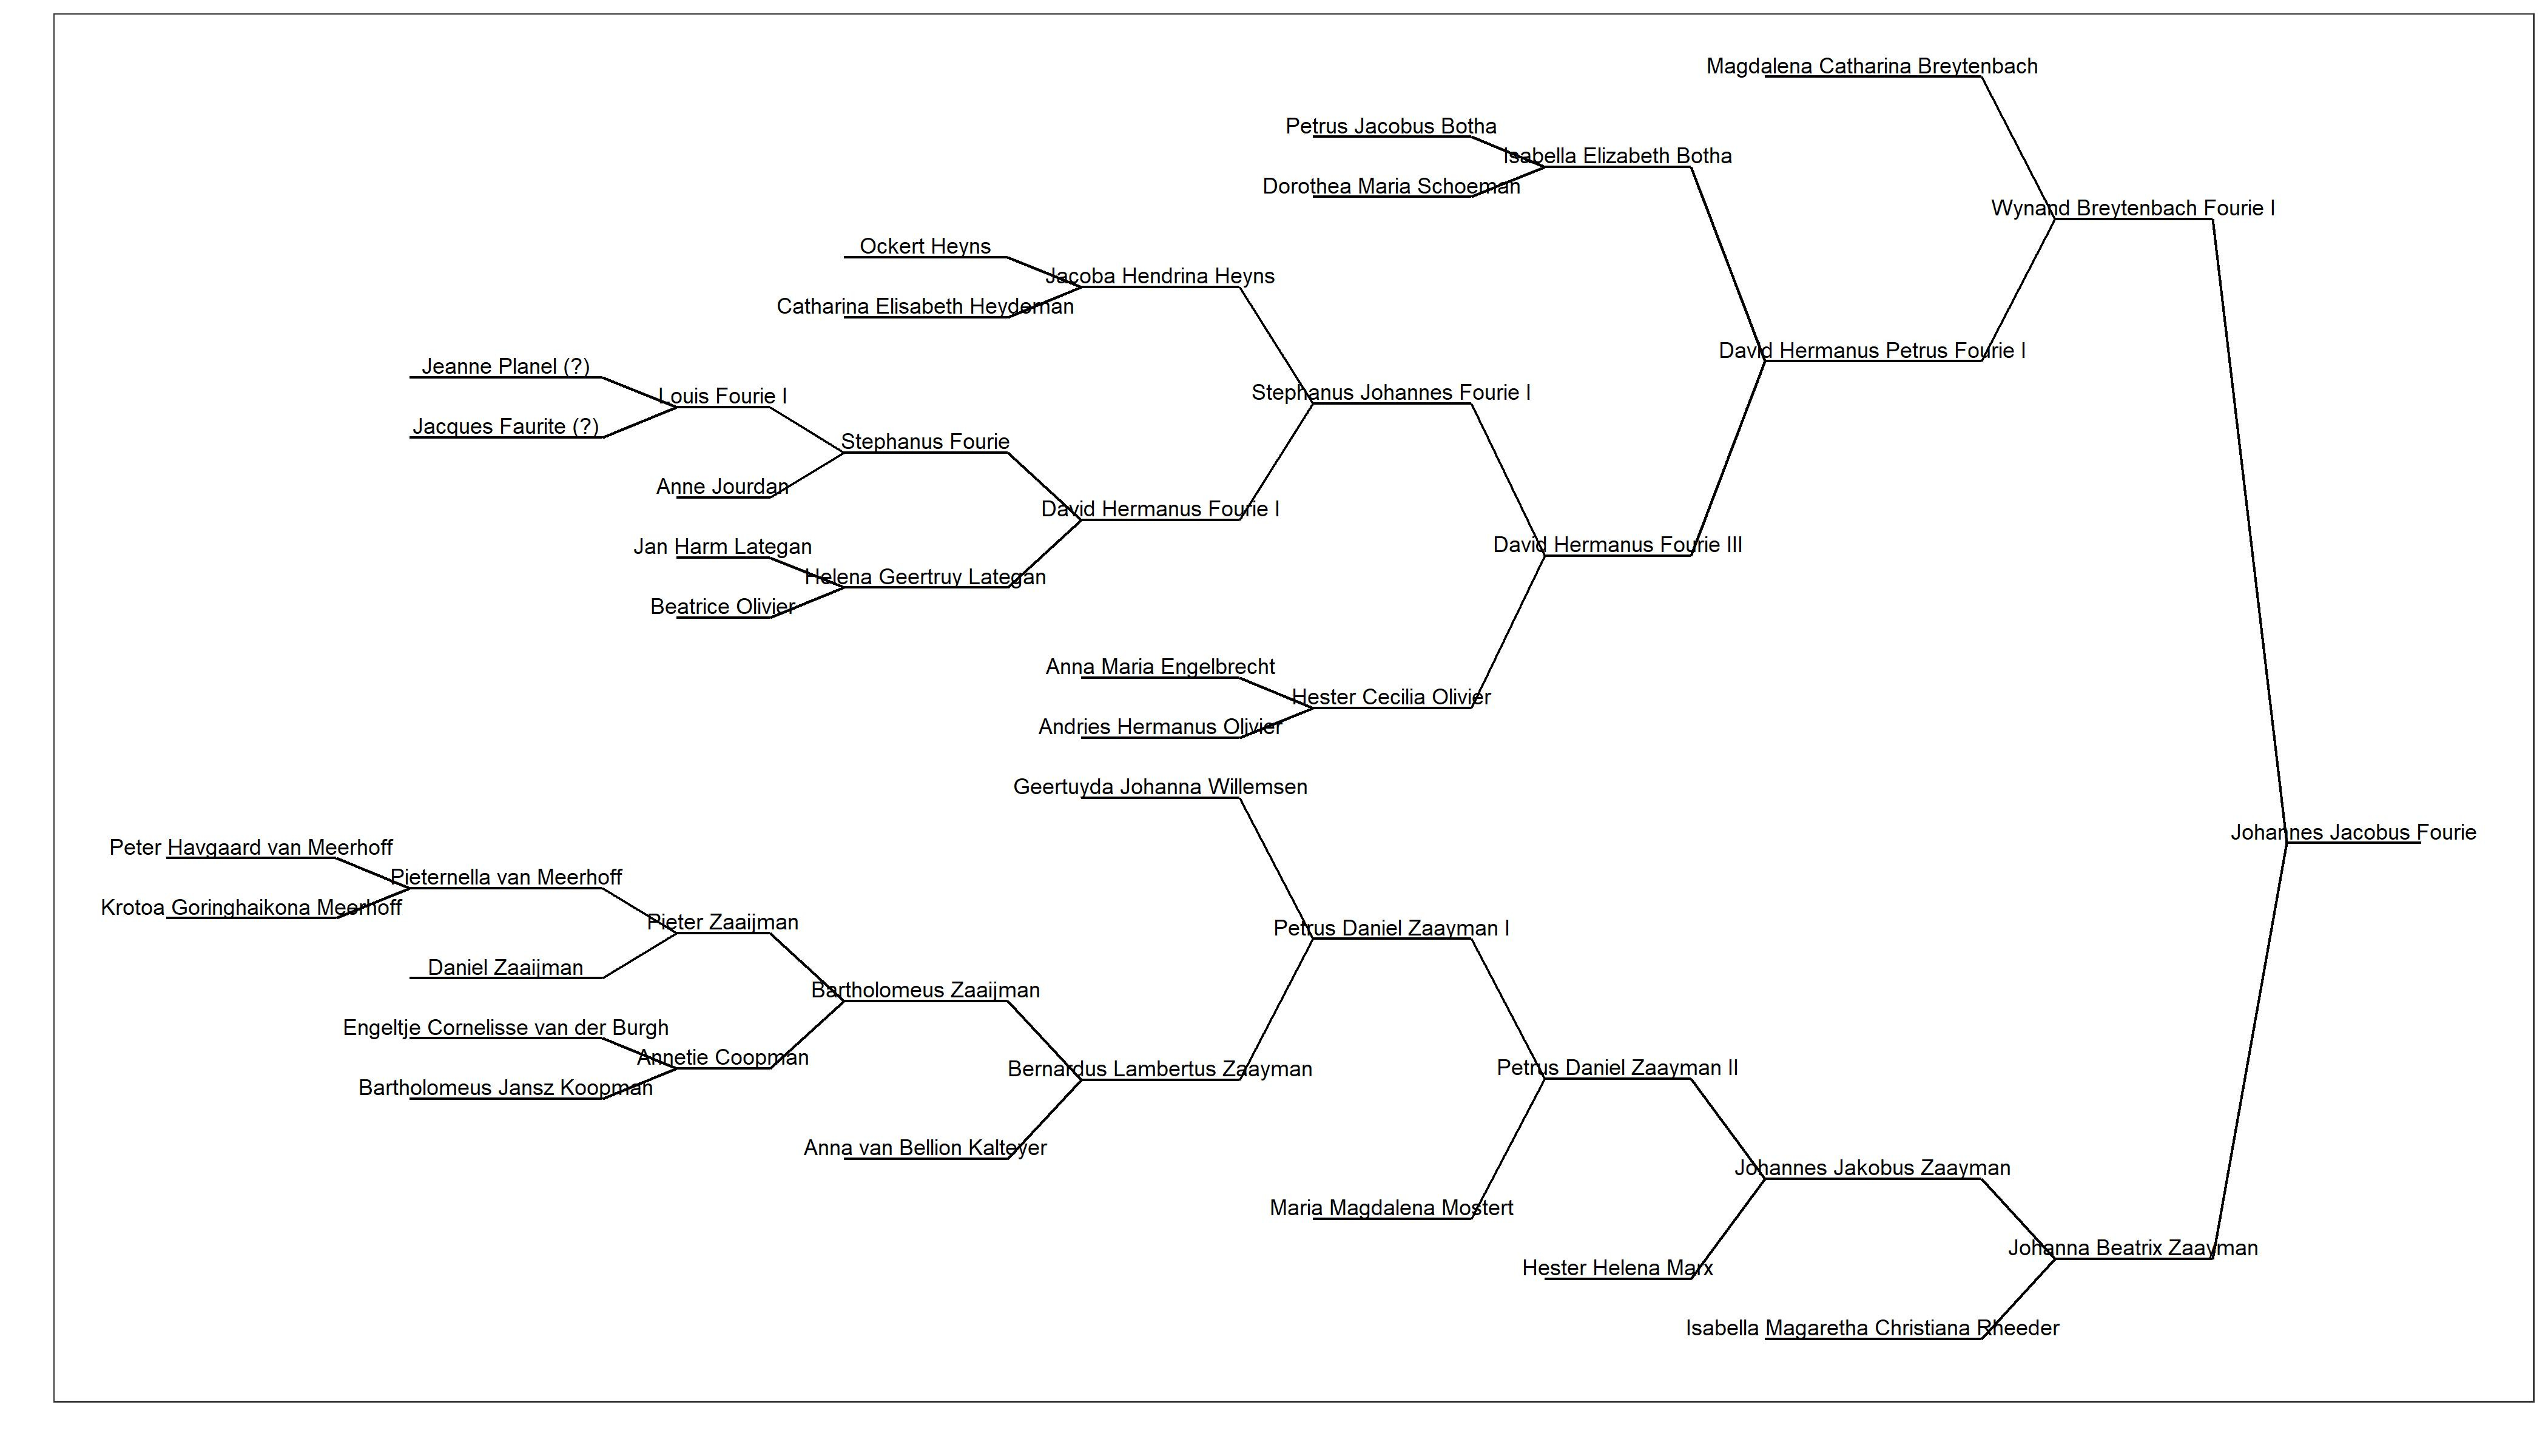
The Dutch Cape Colony was not only a settler colony; it was also a slave economy. Louis owned four slaves when he died in 1750. His 20th child, Stephanus Fourie, born in 1734 died in 1825, only a decade before enslaved workers were emancipated. Stephanus’s fifth child, David Hermanus Fourie, was a slave owner when emancipation came. He owned seven slaves, six men and one woman. The oldest was 33, the youngest 13.
We know this because in 2010 the historian Hans Heese began to build a database of all the slaves recorded in the slave valuation rolls for the Cape Colony. These rolls were compiled after the Slavery Abolition Act was passed in 1833 by the British Parliament, declaring that slaves in most parts of the British Empire had to be freed. There was an important condition, however. All slave owners had to be compensated for the loss of what was then considered their property.
Combining the slave valuation rolls with the compensation payments enabled researchers at Stellenbosch to build the Slave Emancipation Dataset.[4] This dataset makes it possible for us to study the financial underpinnings of slavery in the Colony. Emancipation shifted economic power from the countryside to the city. In Cape Town, many of the merchants who acted as intermediaries between London and the Cape to enable the former owners to get their compensation money, established thriving banks and insurance companies.[5] Others invested in housing, as Kate Ekama and Robert Ross have shown in new work, becoming landlords to those who were formerly enslaved.
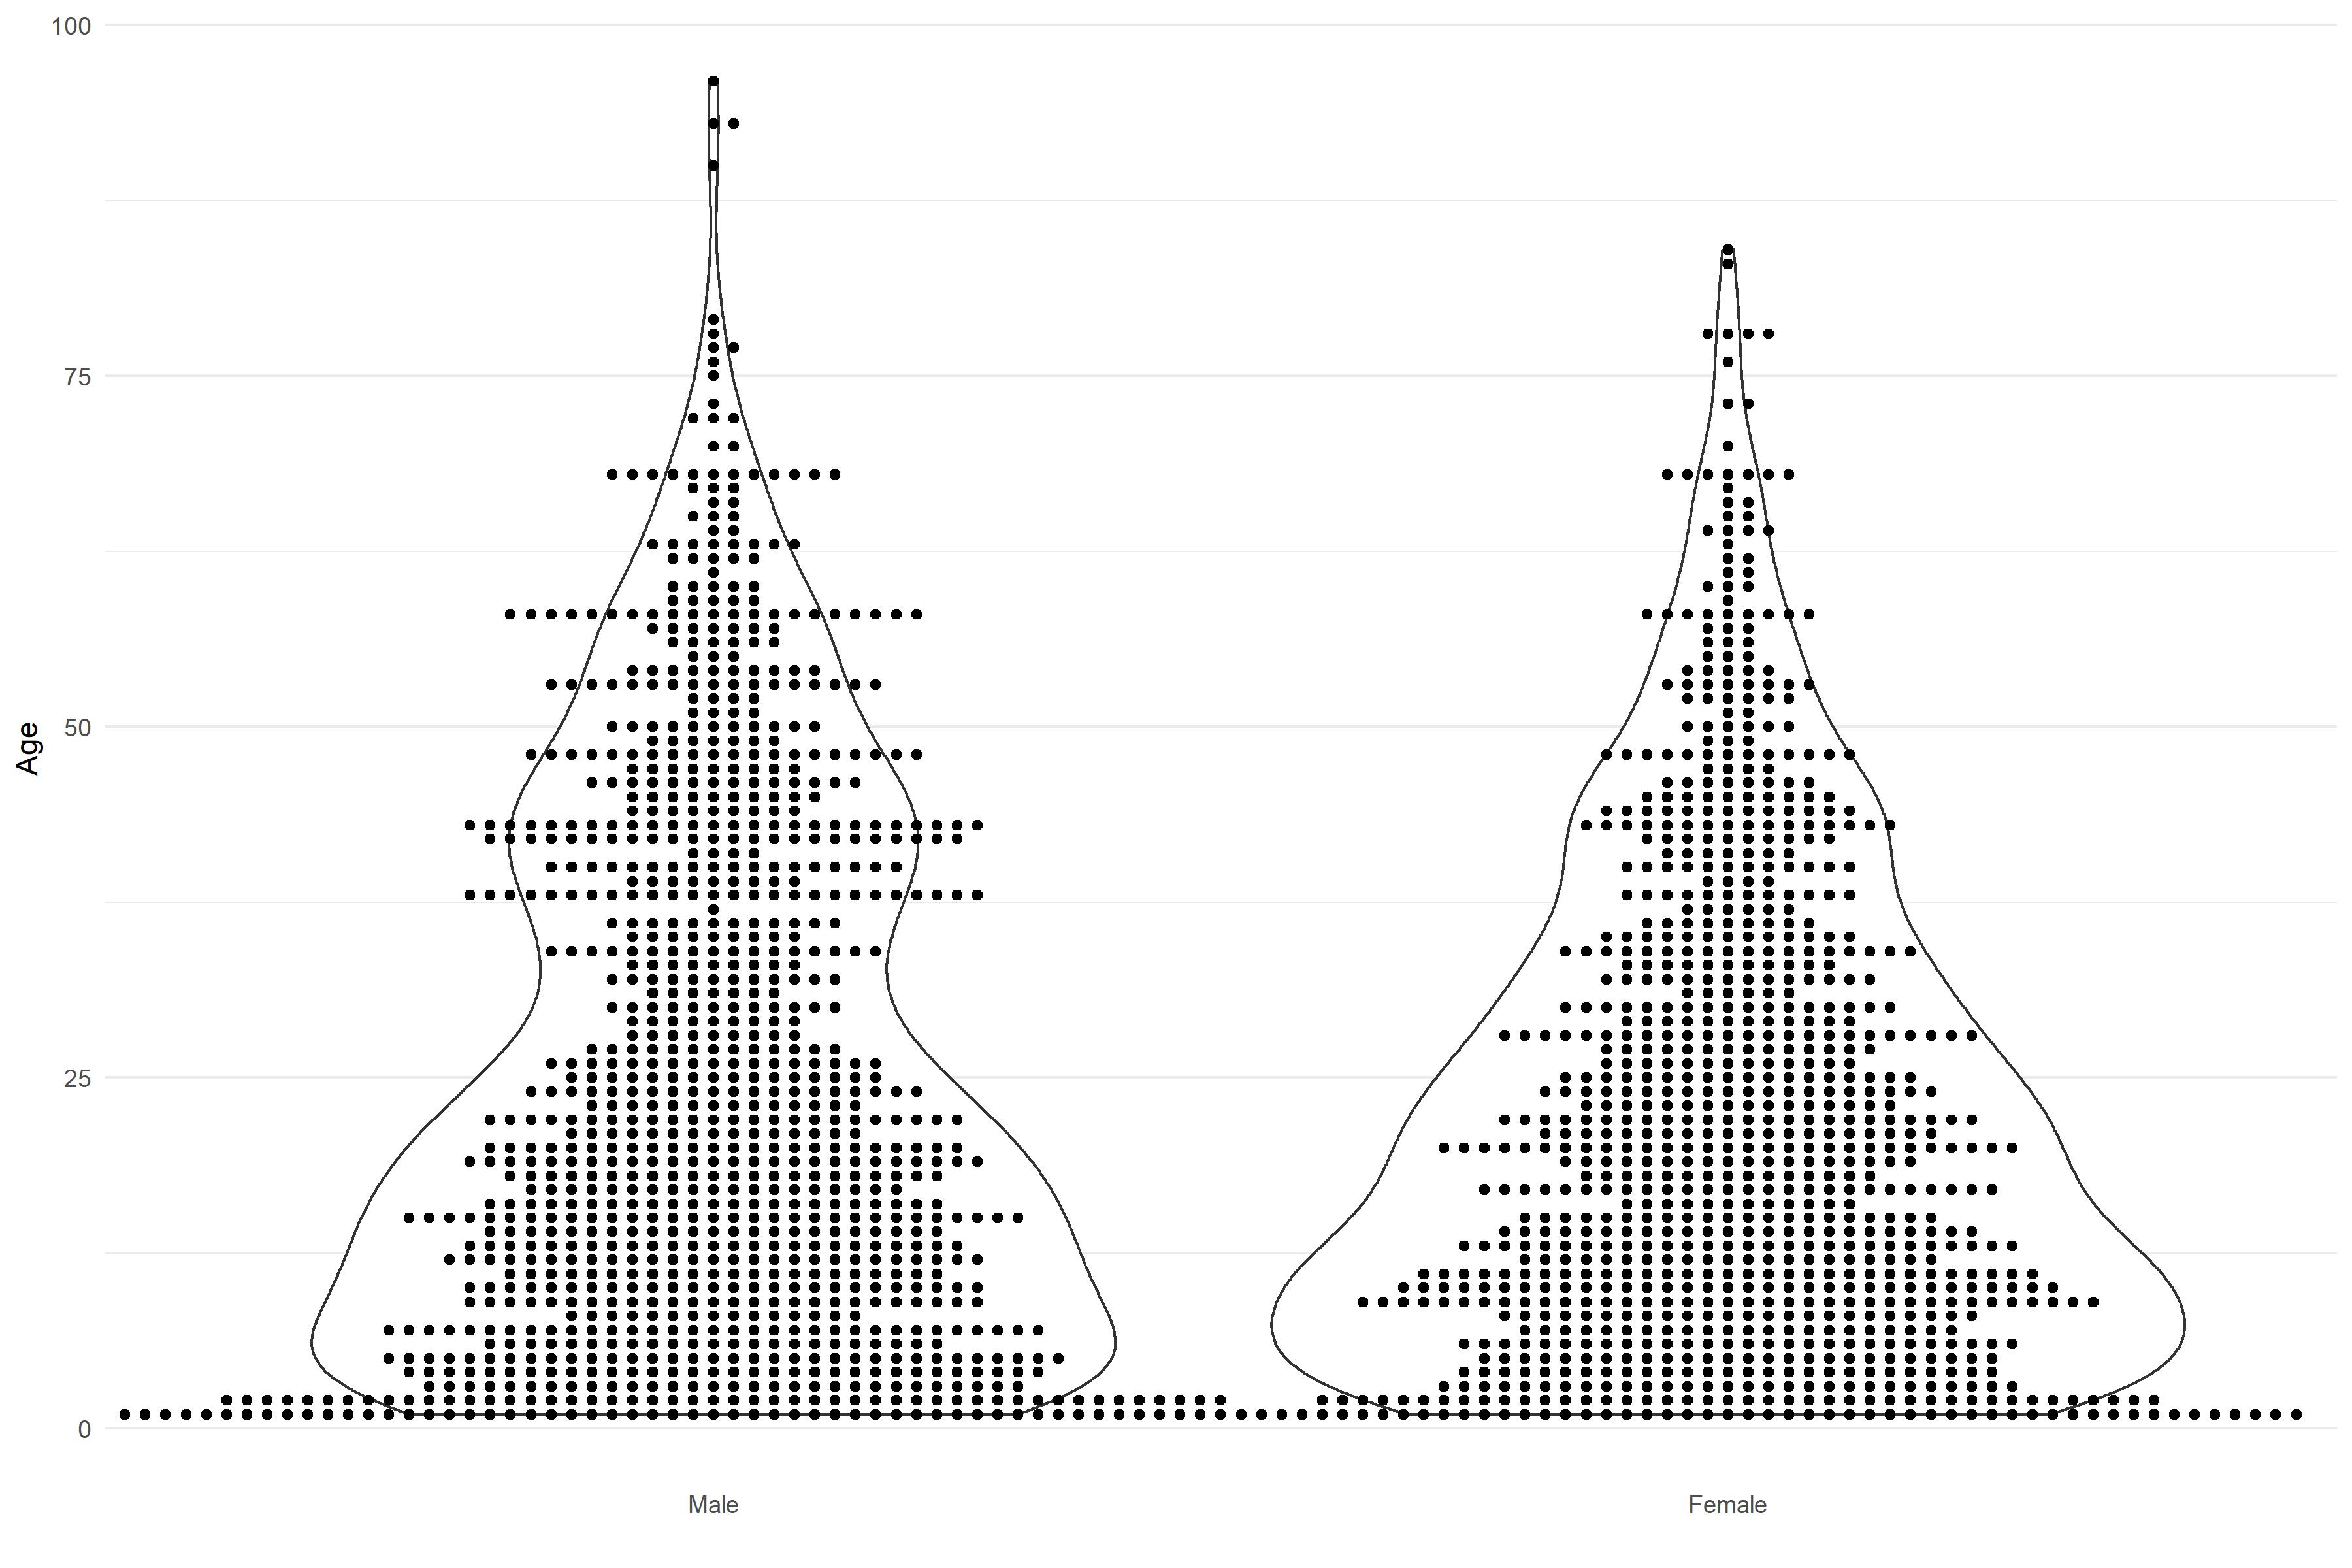
The violin plot shows the distribution of ages of all slaves in the George district, the district where David Hermanus farmed. The higher number of men above 30 reflects the higher demand for men during the slave trade, a trade that was outlawed by the Slave Trade Act of 1807, almost 30 years earlier.
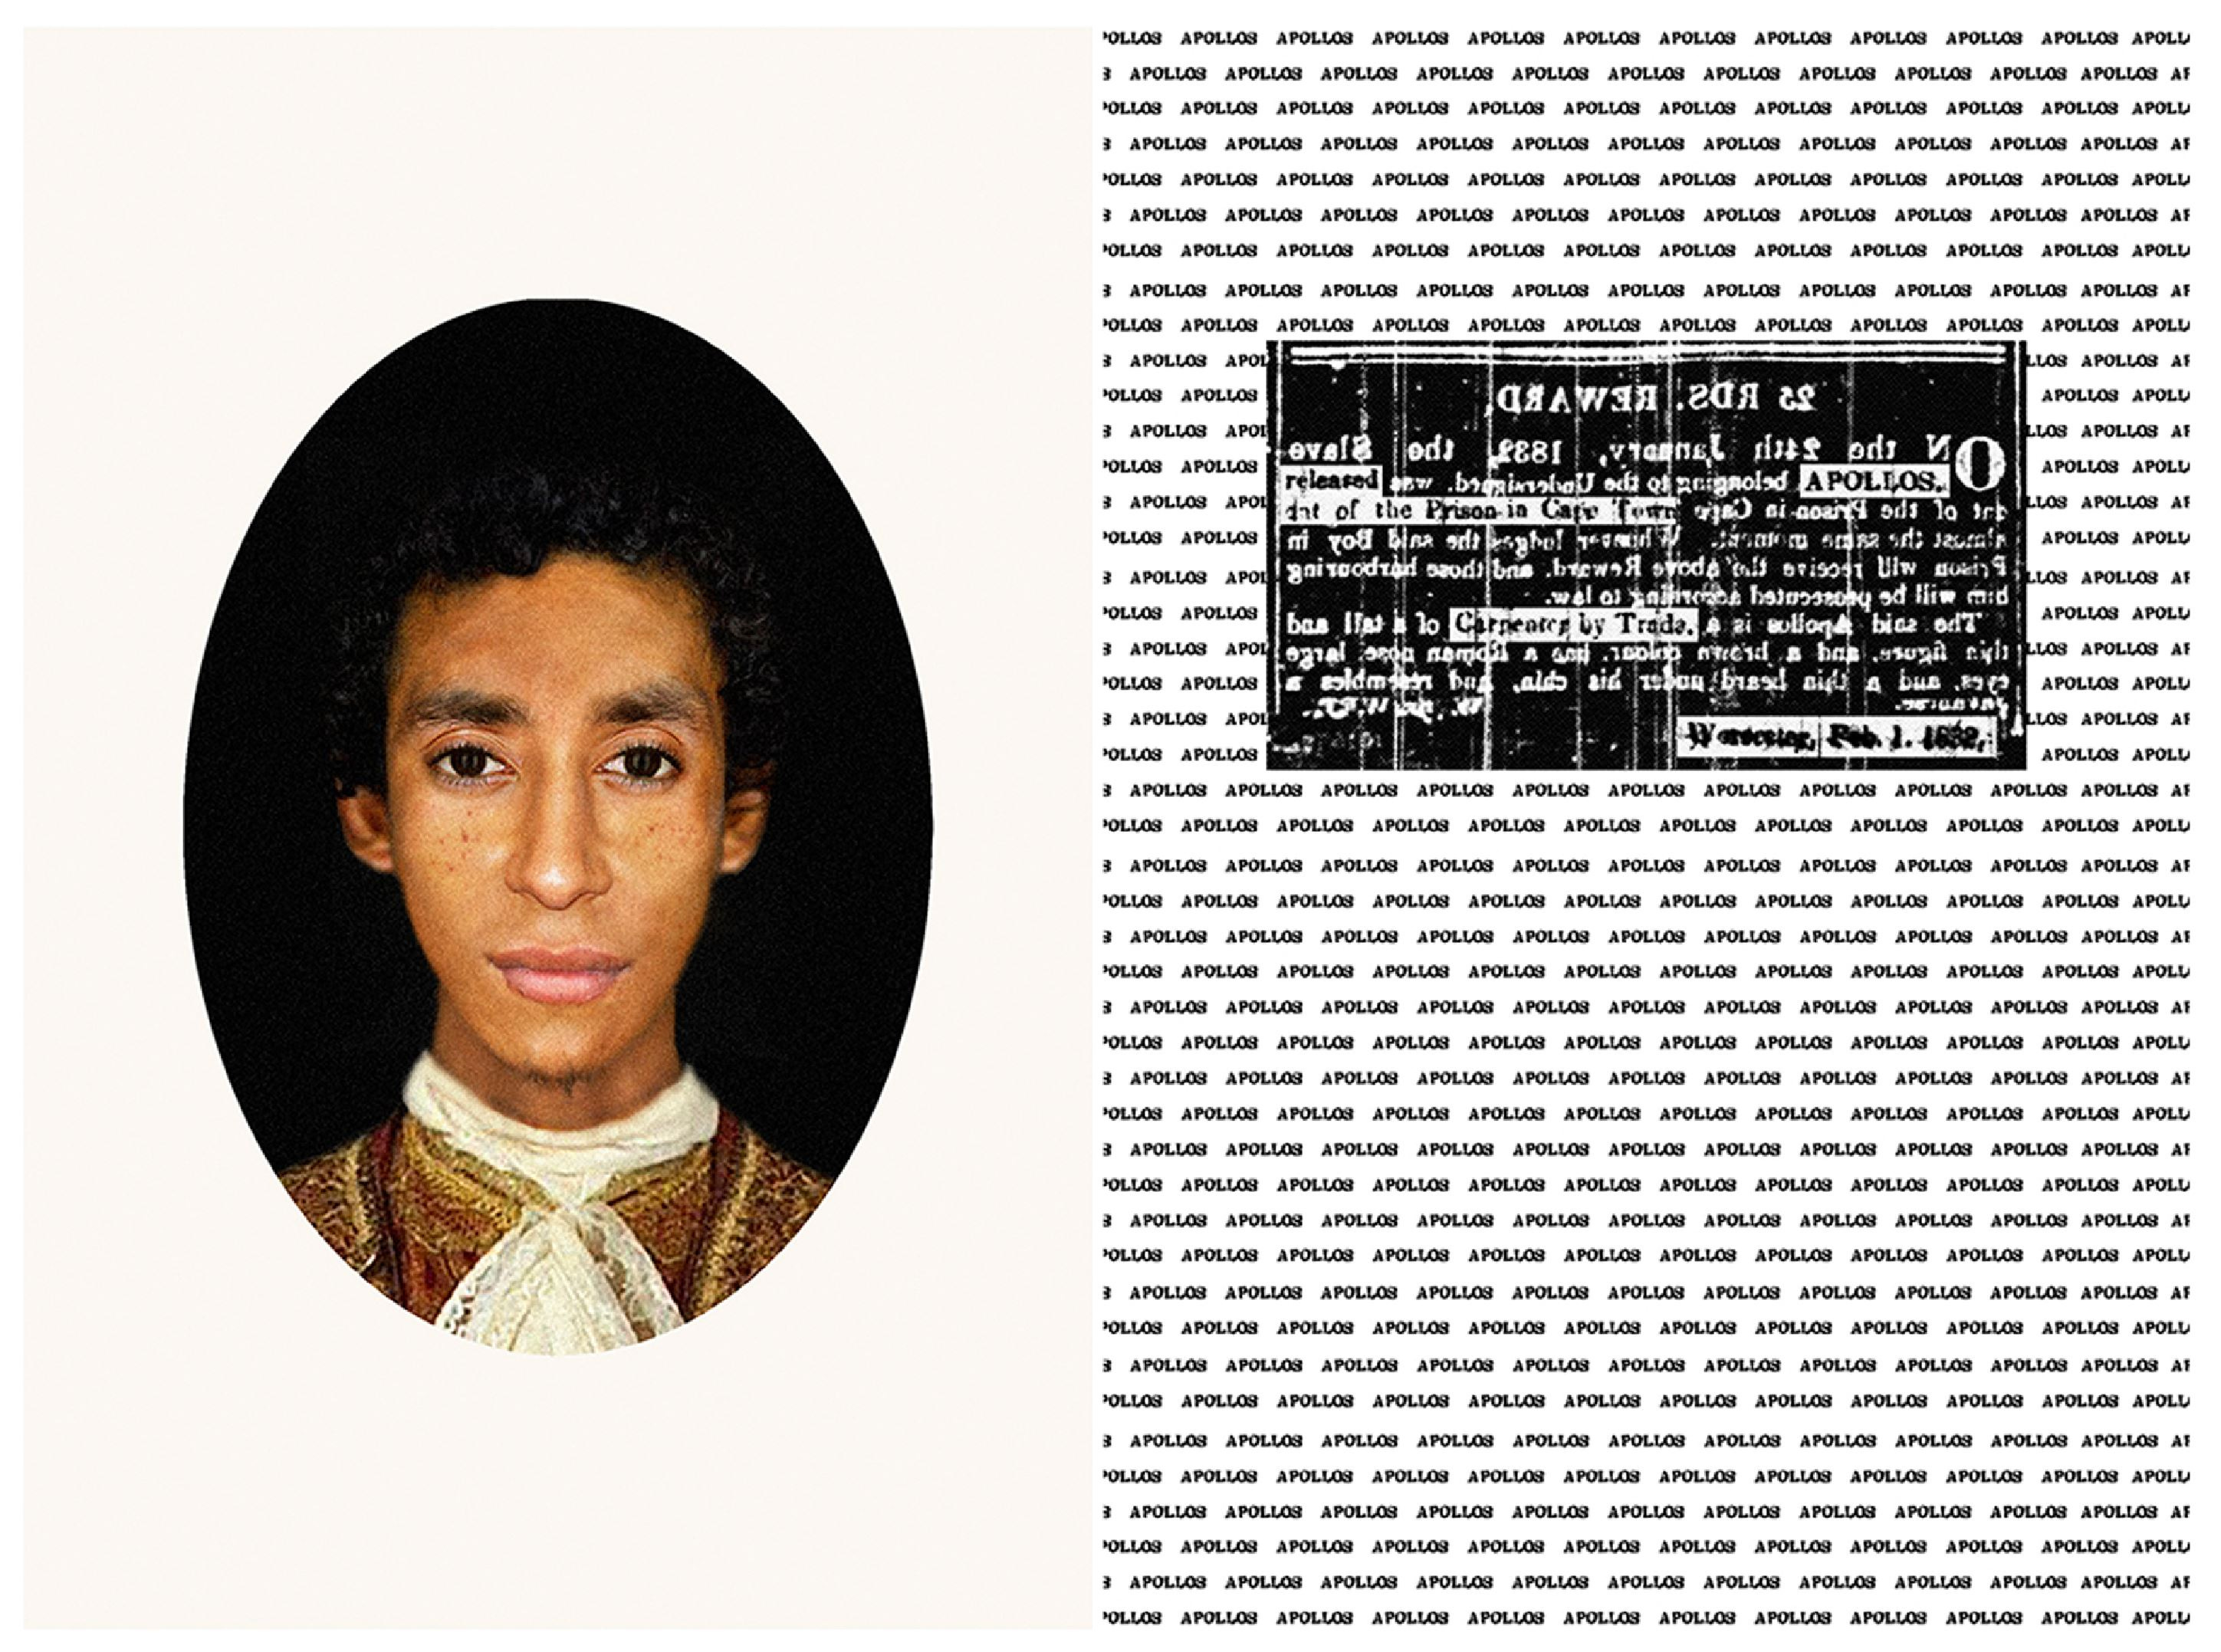
But these statistics, in contrast to conventional sources, can often be impersonal. That has advantages, of course, related to its ethical use, but it also means that one needs to find creative ways to communicate the results to a wider audience. At Stellenbosch, we did that through art. We commissioned two forensic artists, Kathryn Smith and Pearl Mamathuba, to use descriptions of slave run-away advertisements to produce images of the enslaved in our records. (See this post about the project and a documentary linked to it.) Here is the image of Apollos, an enslaved carpenter. Born at the Cape, with a skill to his name and the ability to pass as ‘Javanese’, thereby resembling a free black artisan, Apollos remained on the run for almost two years.
The stories of Apollos and Louis show that vast, unexplored data, often of a demographic nature, exists beyond Europe, of Europeans and their descendants, but also of the many non-Europeans who encountered European explorers, traders or colonisers. New tools, from OCR techniques to machine learning algorithms, can now make those sources accessible at a much lower cost than before. (And I am happy to report, reading through the programme, that many of those techniques are on display at this conference.)
But these tools are often not easily accessible to local scholars, where expertise, networks and funding remain constrained for a variety of reasons; partnerships, I want to propose, are vital if we are to bring these stories to life, to preserve, to understand, and to share them on a global scale. This kind of mutual engagement makes the unearthed information not just a scholarly asset but also a treasure of cultural heritage.
To give one example. Two weeks ago, I shared the Slave Emancipation Dataset with a local heritage society of a former mission station close to Stellenbosch. The records of enslaved workers were, of course, collected for financial reasons. But used creatively, these sources can provide fascinating insights into not only the economic but also the family, social and cultural history of a group for which conventional archival sources – like diaries or letters – are often lacking. Members of the heritage society have written to us to express their gratitude for making such sources accessible, as it has already allowed them to reconstruct their own family histories and thus also their identity.
That, in short, was the purpose of the Biography of an Uncharted People project, which I coordinated at Stellenbosch University for the last five years. Our book – Quantitative History and Uncharted People – is now available for pre-order on Amazon.[6] (See also this post, and this earlier one.)
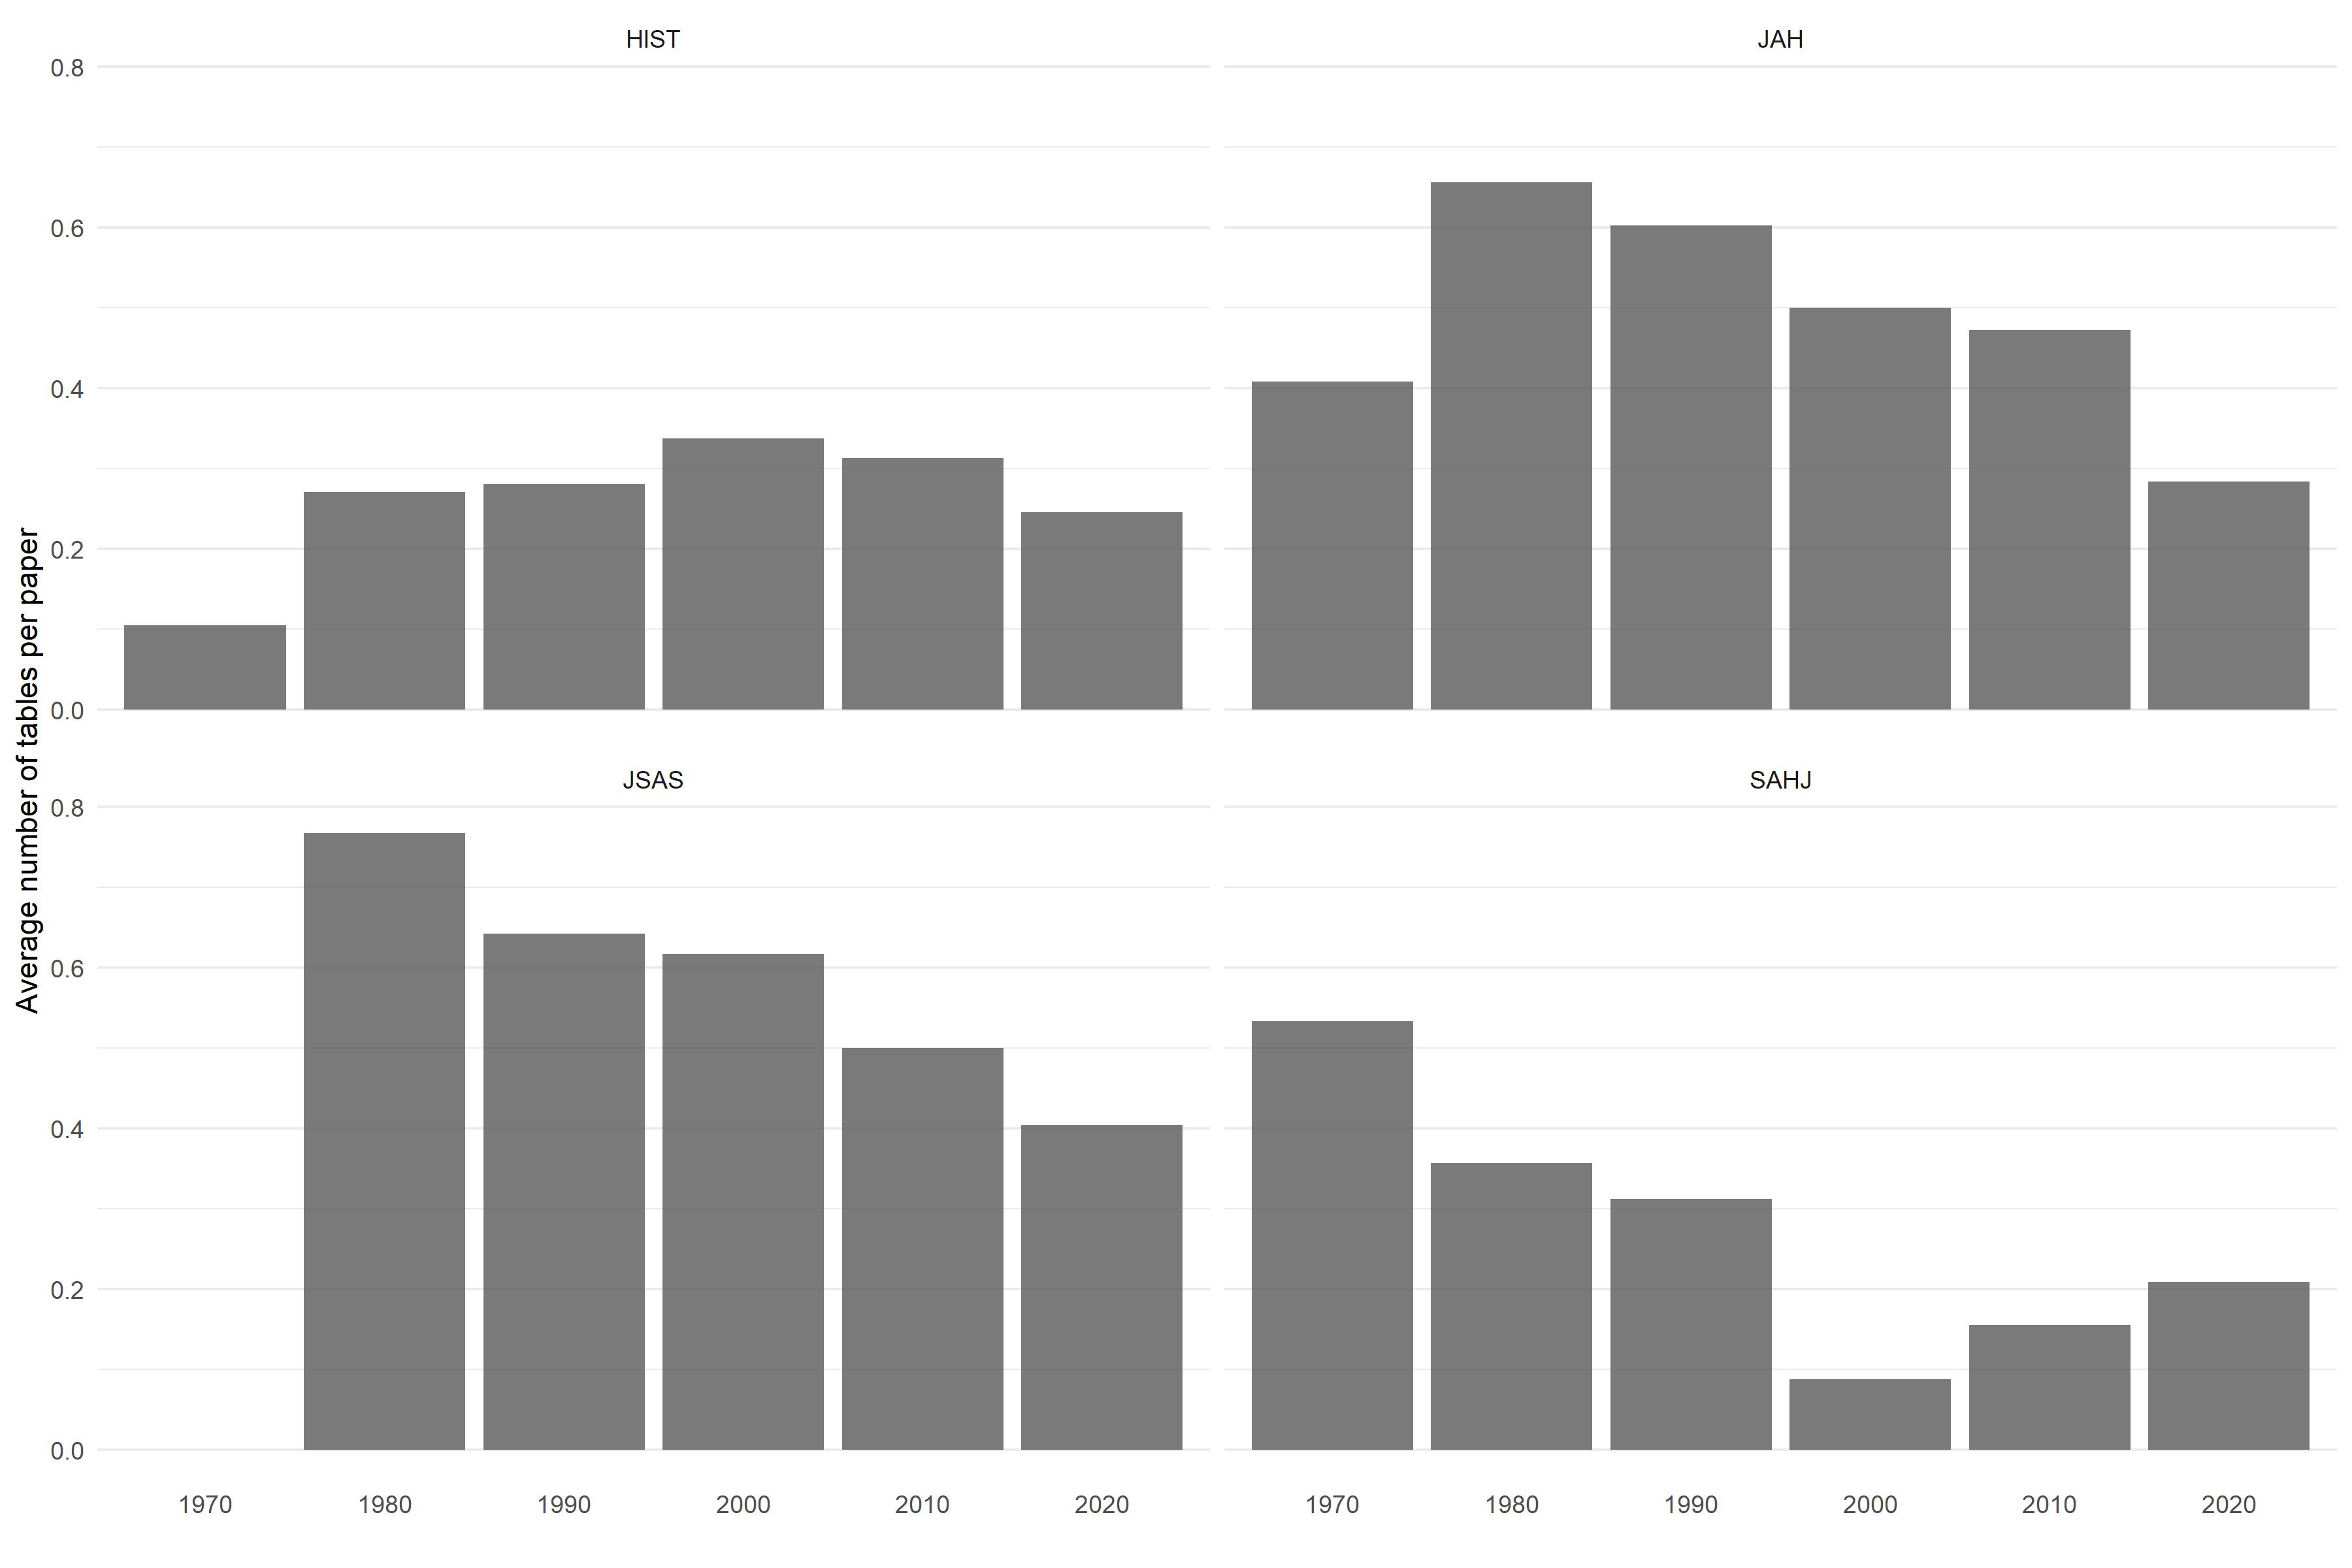
In the introduction, I make a simple case for quantitative history.[7] I show, first, that quantification in history is on the decline, as can be seen from the number of papers using quantitative methods in leading African history journals over the last few decades.
Yet telling stories with numbers can be especially powerful in a country like South Africa, where large quantities of historical records are preserved but questions of bias and prejudice persist. With statistical tools, we can extract information from historical documents and make it tell us far more than could have been imagined by those who collected and preserved it.
Here, I want to emphasise that historical demography is one of the few subdisciplines of history that can utilise these rich sources to tell stories of ‘uncharted people’. To give you a few examples from the book. With Francisco Gracia, I use census data to investigate sex ratios over a century for three population groups in South Africa.[8] We find a large female preference amongst black South African infants, with much lower differences between boys and girls for the other two race groups. Amy Rommelspacher, who is in the audience here, use a 1930s survey to refute the claim by historians that all white families had domestic workers.[9] With Brittany Chalmers and Kris Inwood, I use marriage records to calculate the extent of racial reclassification during the apartheid era. We show that reclassification to ‘white’ unambiguously improved a couple’s economic prospects, and once reclassified, wives were likely to leave the labour market to fit the white stereotype of a male-breadwinner household. Combining these marriage records with baptism records, Laura Richardson and Jan Kok calculate bridal pregnancy in Anglican Cape Town, showing that in some neighbourhoods, more than a third of women were pregnant on their wedding day.[10] None of the conventional archival sources would have allowed us to identify these historical truths.
The final chapter of the book points to an important challenge in using quantitative history methods: students’ willingness and capacity to master it.[11] I show that very few of the History class at Stellenbosch University completed high school mathematics. I’ve also learned through the Biography project that there is great resistance, notably from my colleagues in the Humanities, against teaching quantitative methods to students. Here, again, historical demographers can help, by introducing quantitative sources and methods in a way that, as Claire Lemercier and Claire Zalc note, ‘address math anxiety, not reinforce it’.[12]
By 1850, the Cape Colony had become a territory the size of modern-day Vietnam, Finland or Côte d’Ivoire. The map below shows the 5,503 farms of the Cape Colony in 1850. The black dots are Fourie-owned farms. There were 37 of them, or about 0.7% of the total. I also indicate the farm Stephanus Johannes Fourie, the son of David Hermanus Fourie, my great-great-great-great-grandfather.

One important source that can bring us much closer to the story of all of us, and one almost completely neglected by South African historians, is death notices. In the Uncharted People book, Jonathan Jayes and I use death notices to investigate the incidence of the Spanish flu.[13] In earlier work, we used a doctor’s signature on a notice as evidence of health services, and showed how the Spanish flu exacerbated health inequality, particularly for black and coloured residents of the Cape Colony.[14]
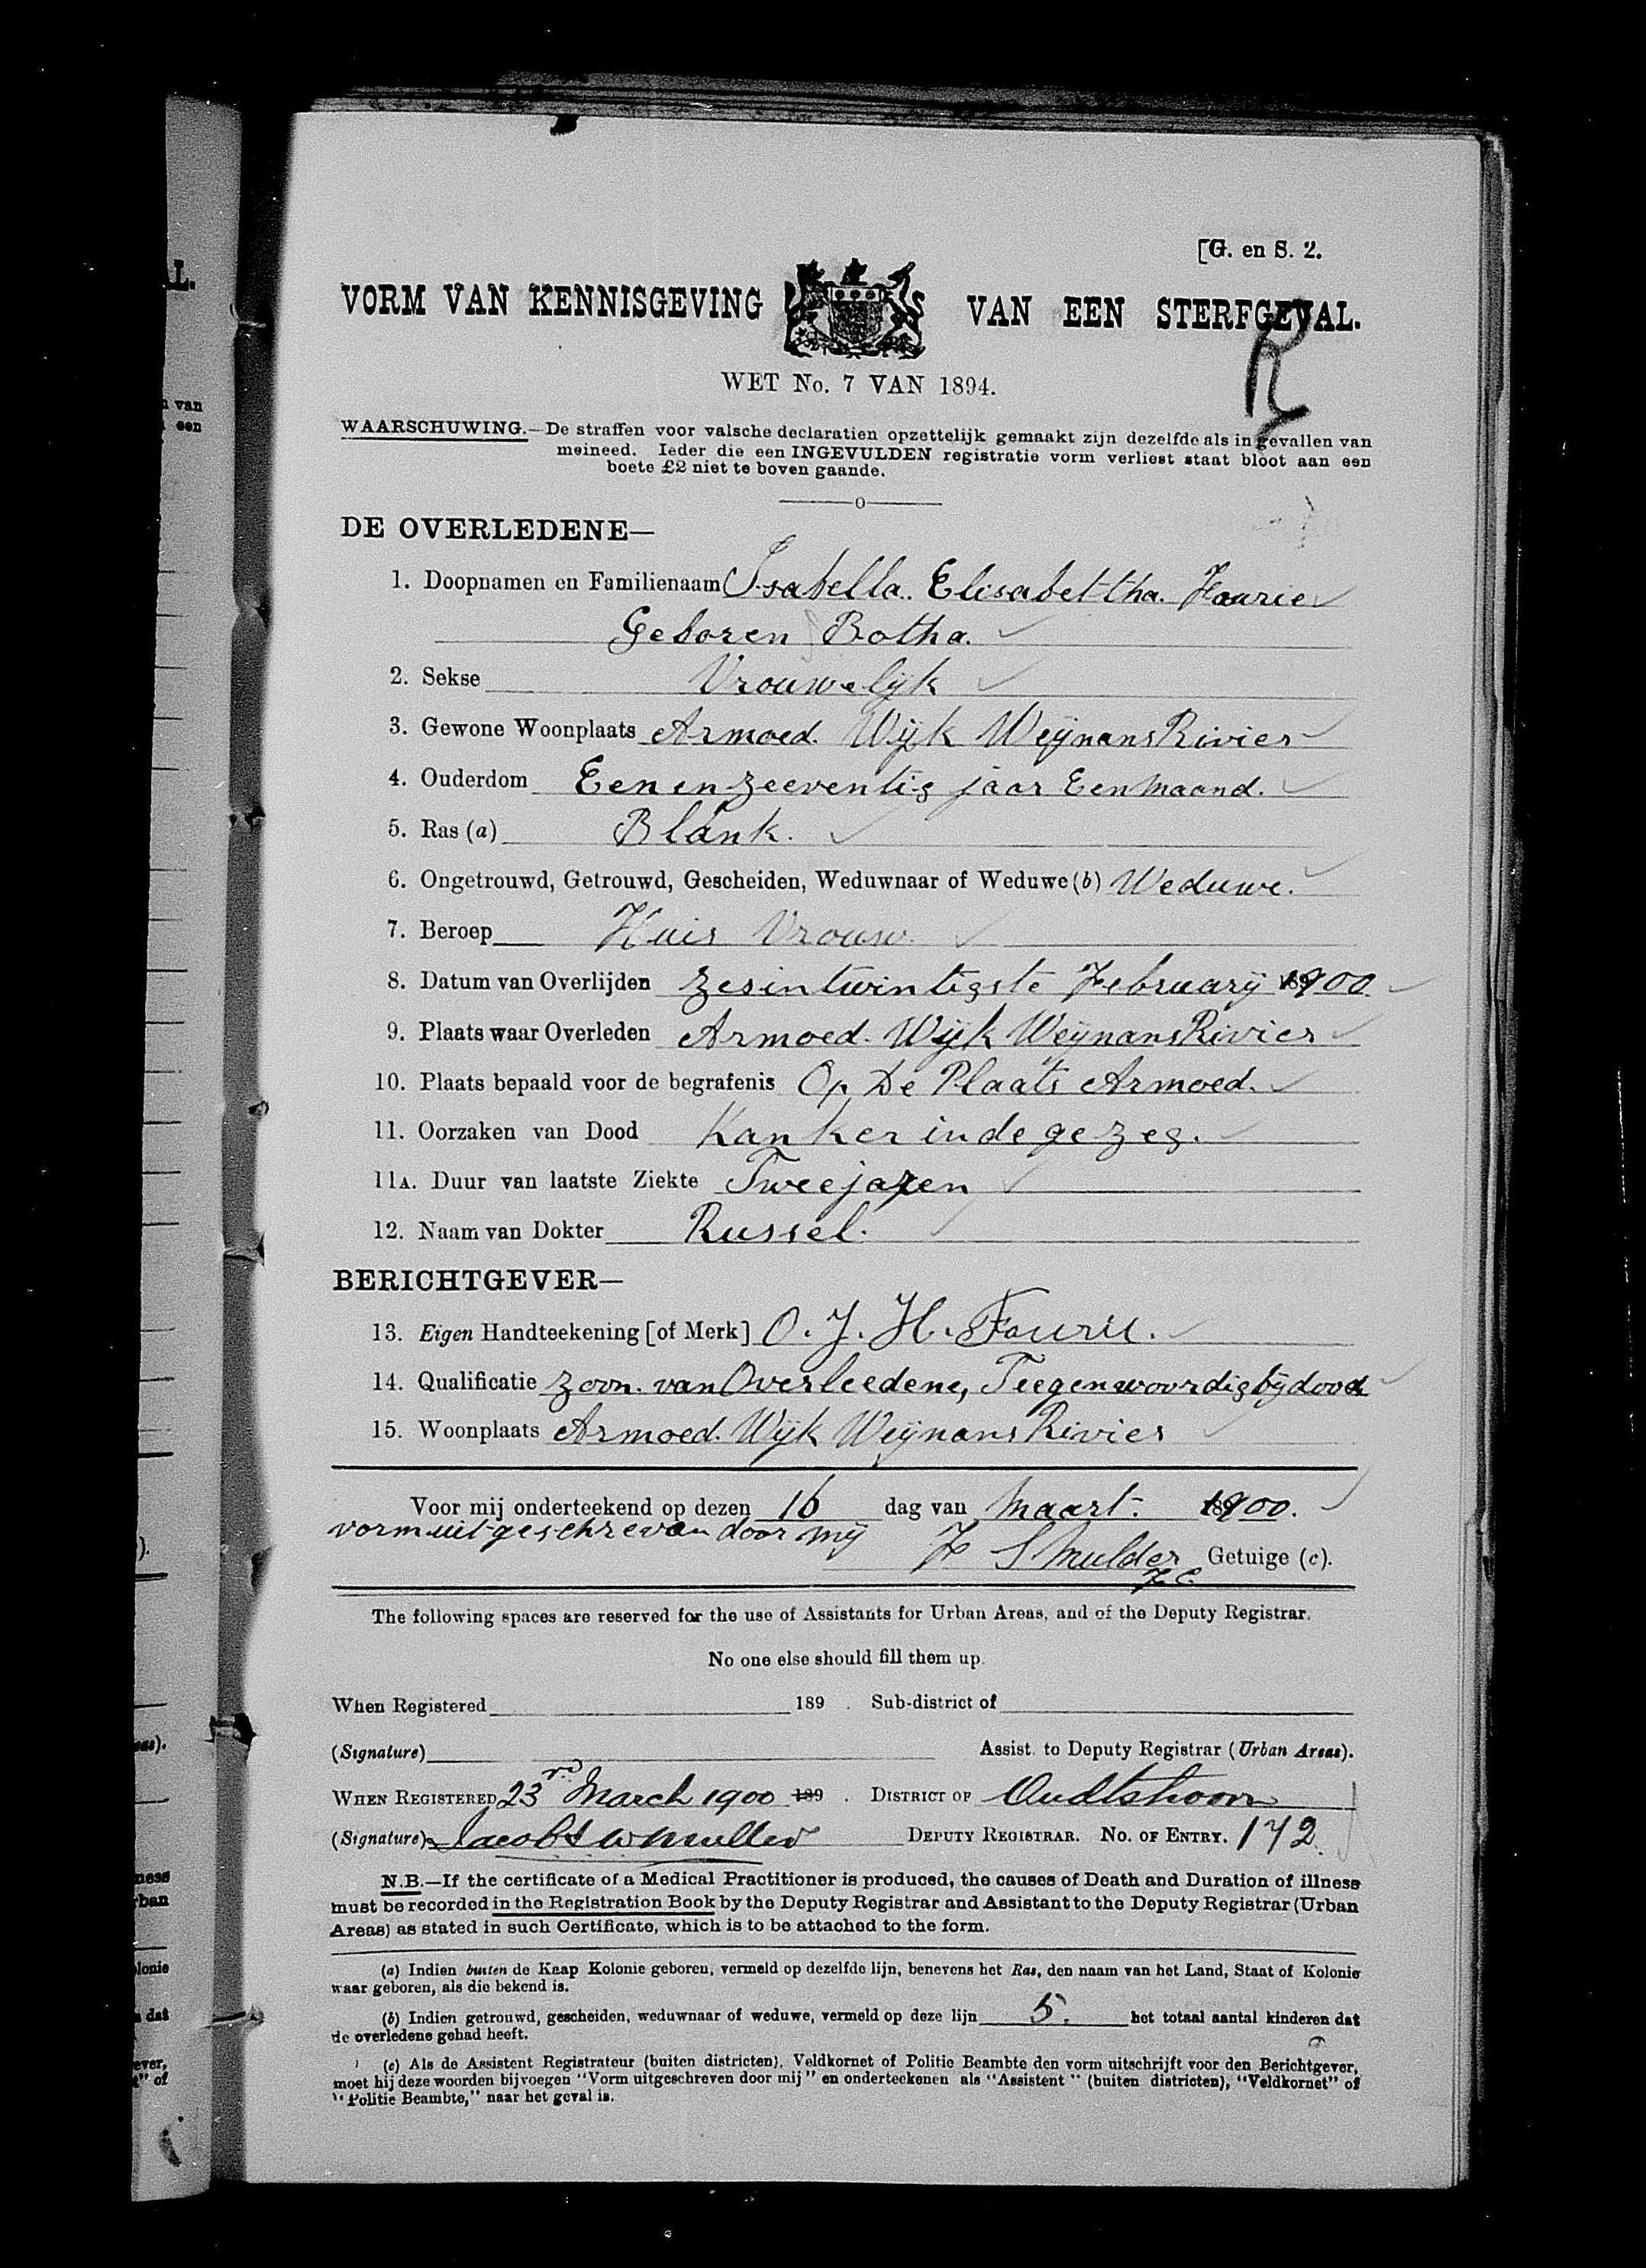
The image shows the death notice of Isabella Elizabeth Fourie, my great-great-great grandmother (or Stephanus Fourie’s daughter-in-law). On its own, it helps me understand my own family history, of course, but put it within a wider context, and it also helps me understand the community I come from, and the history of my country.
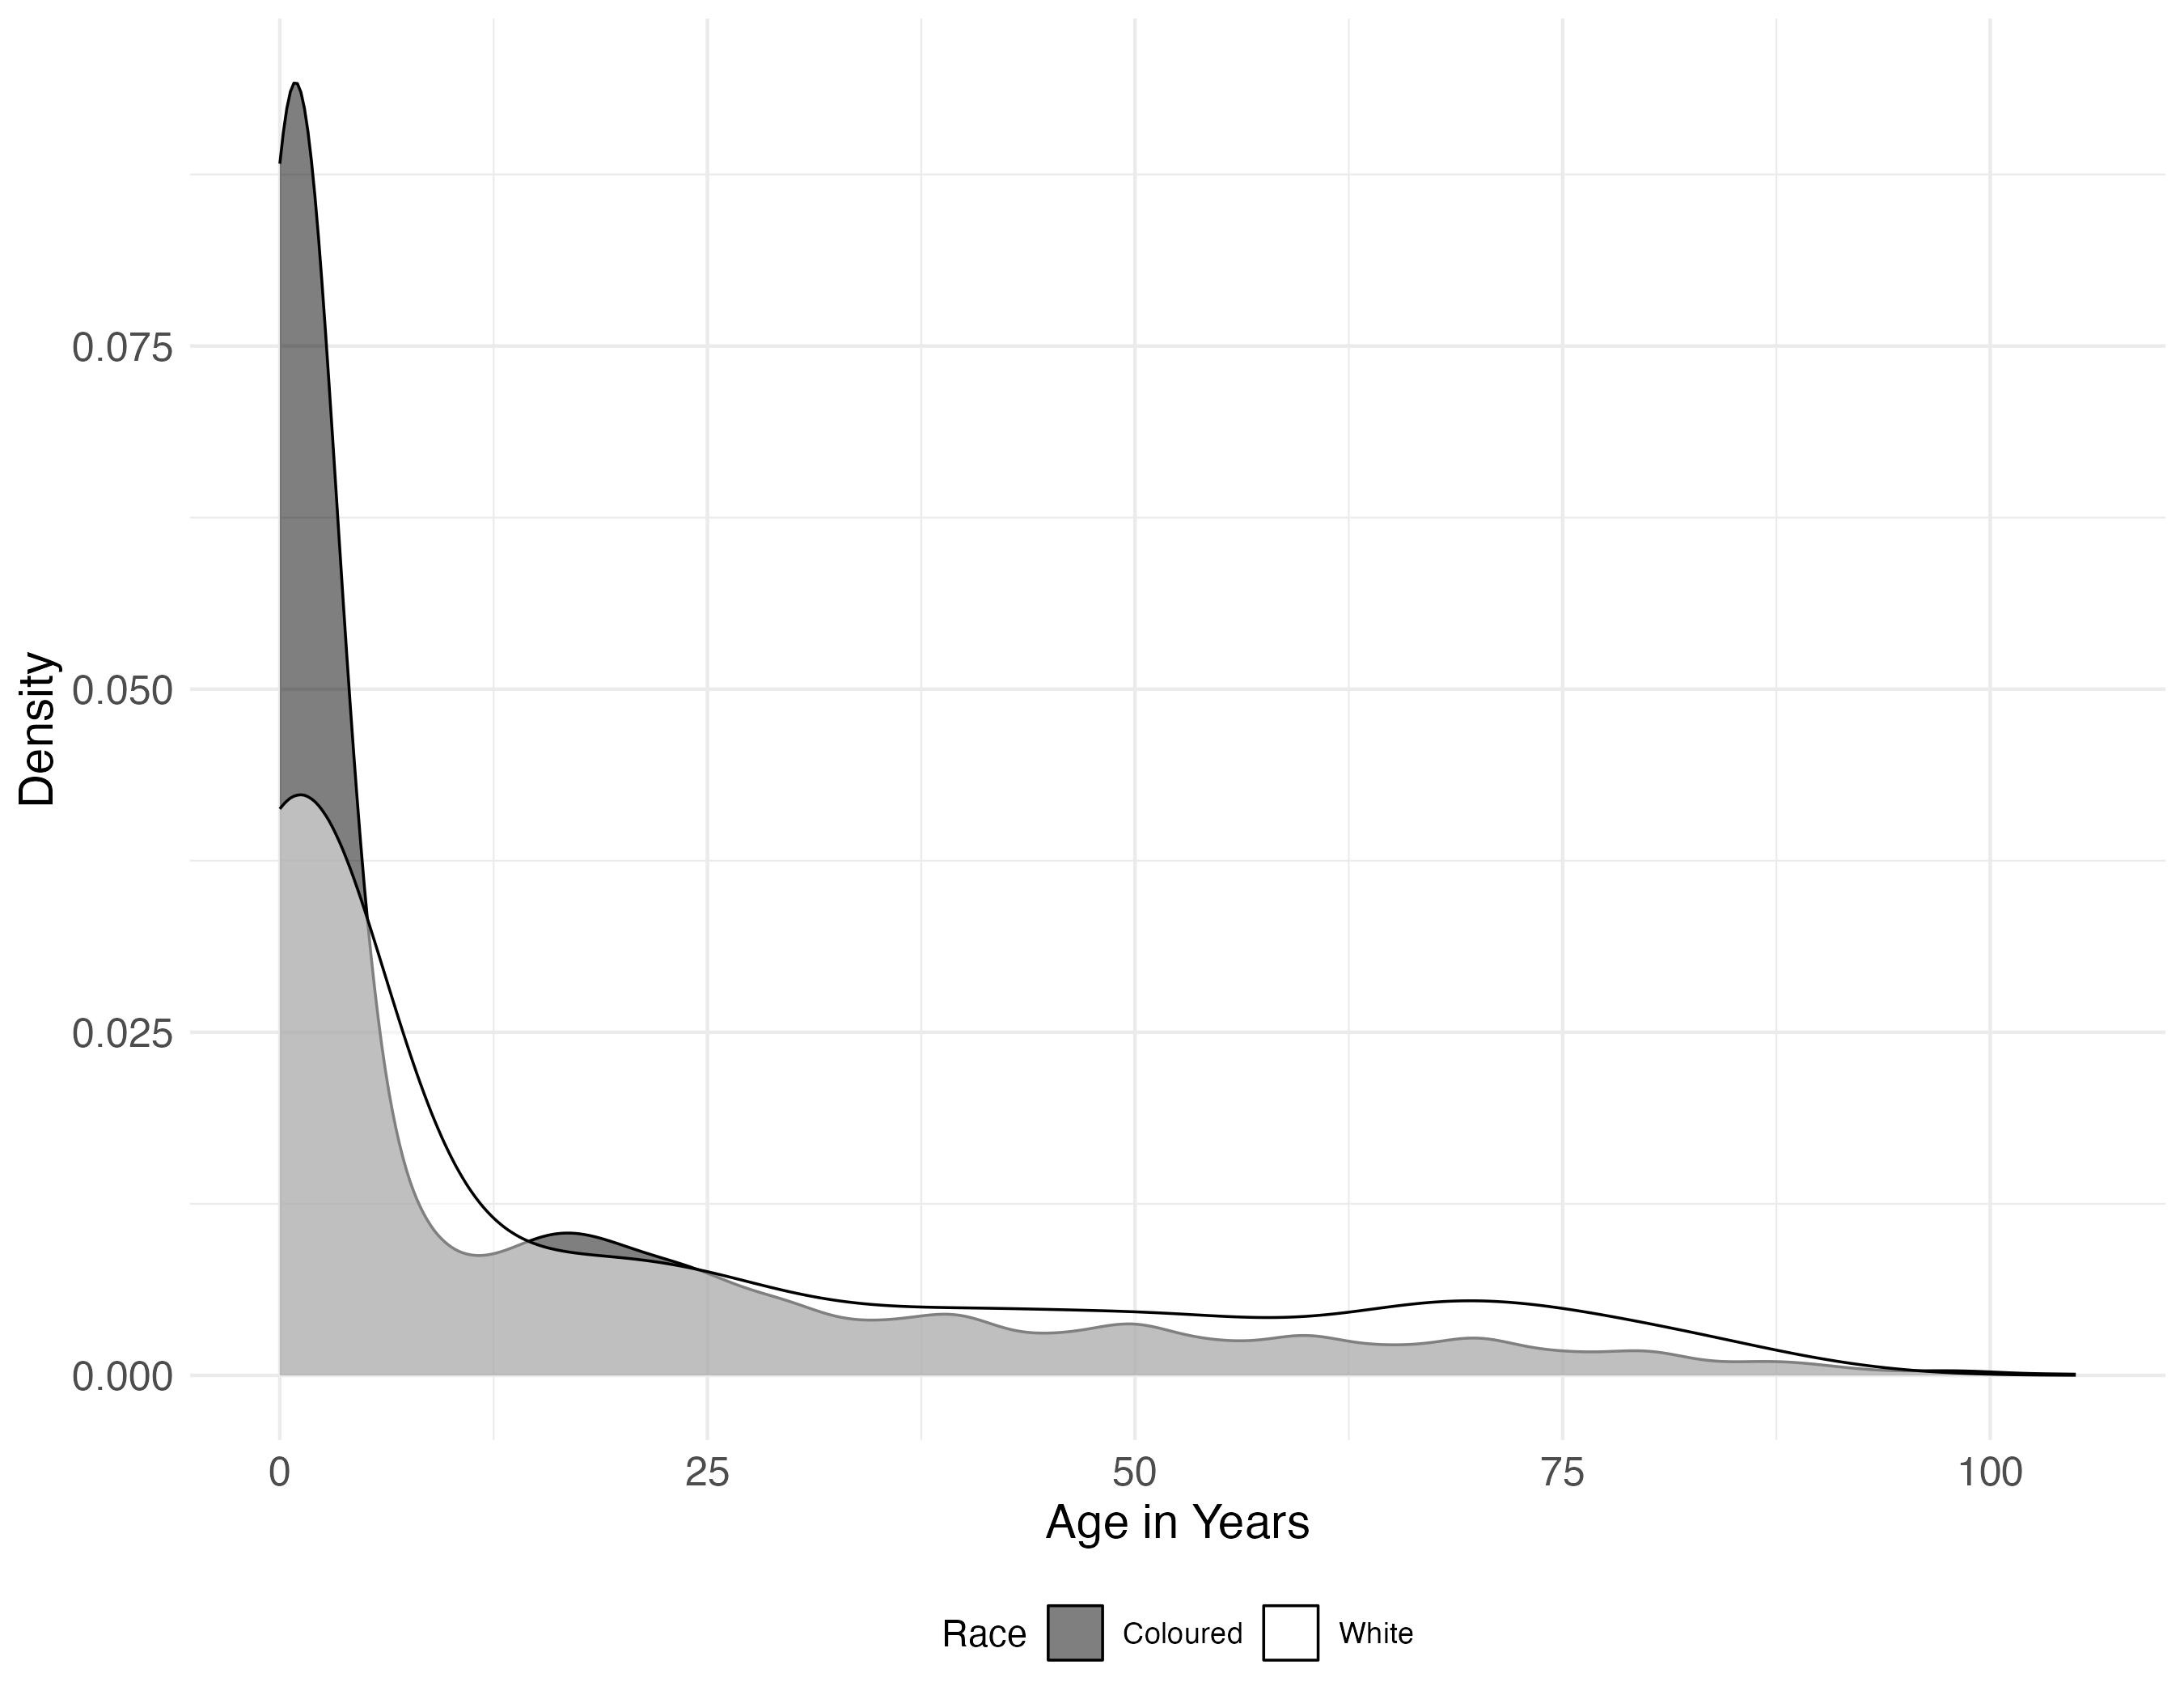
The figure shows all the deaths in Oudtshoorn between 1895 and 1905. The names are those individuals who died in the same farming district.
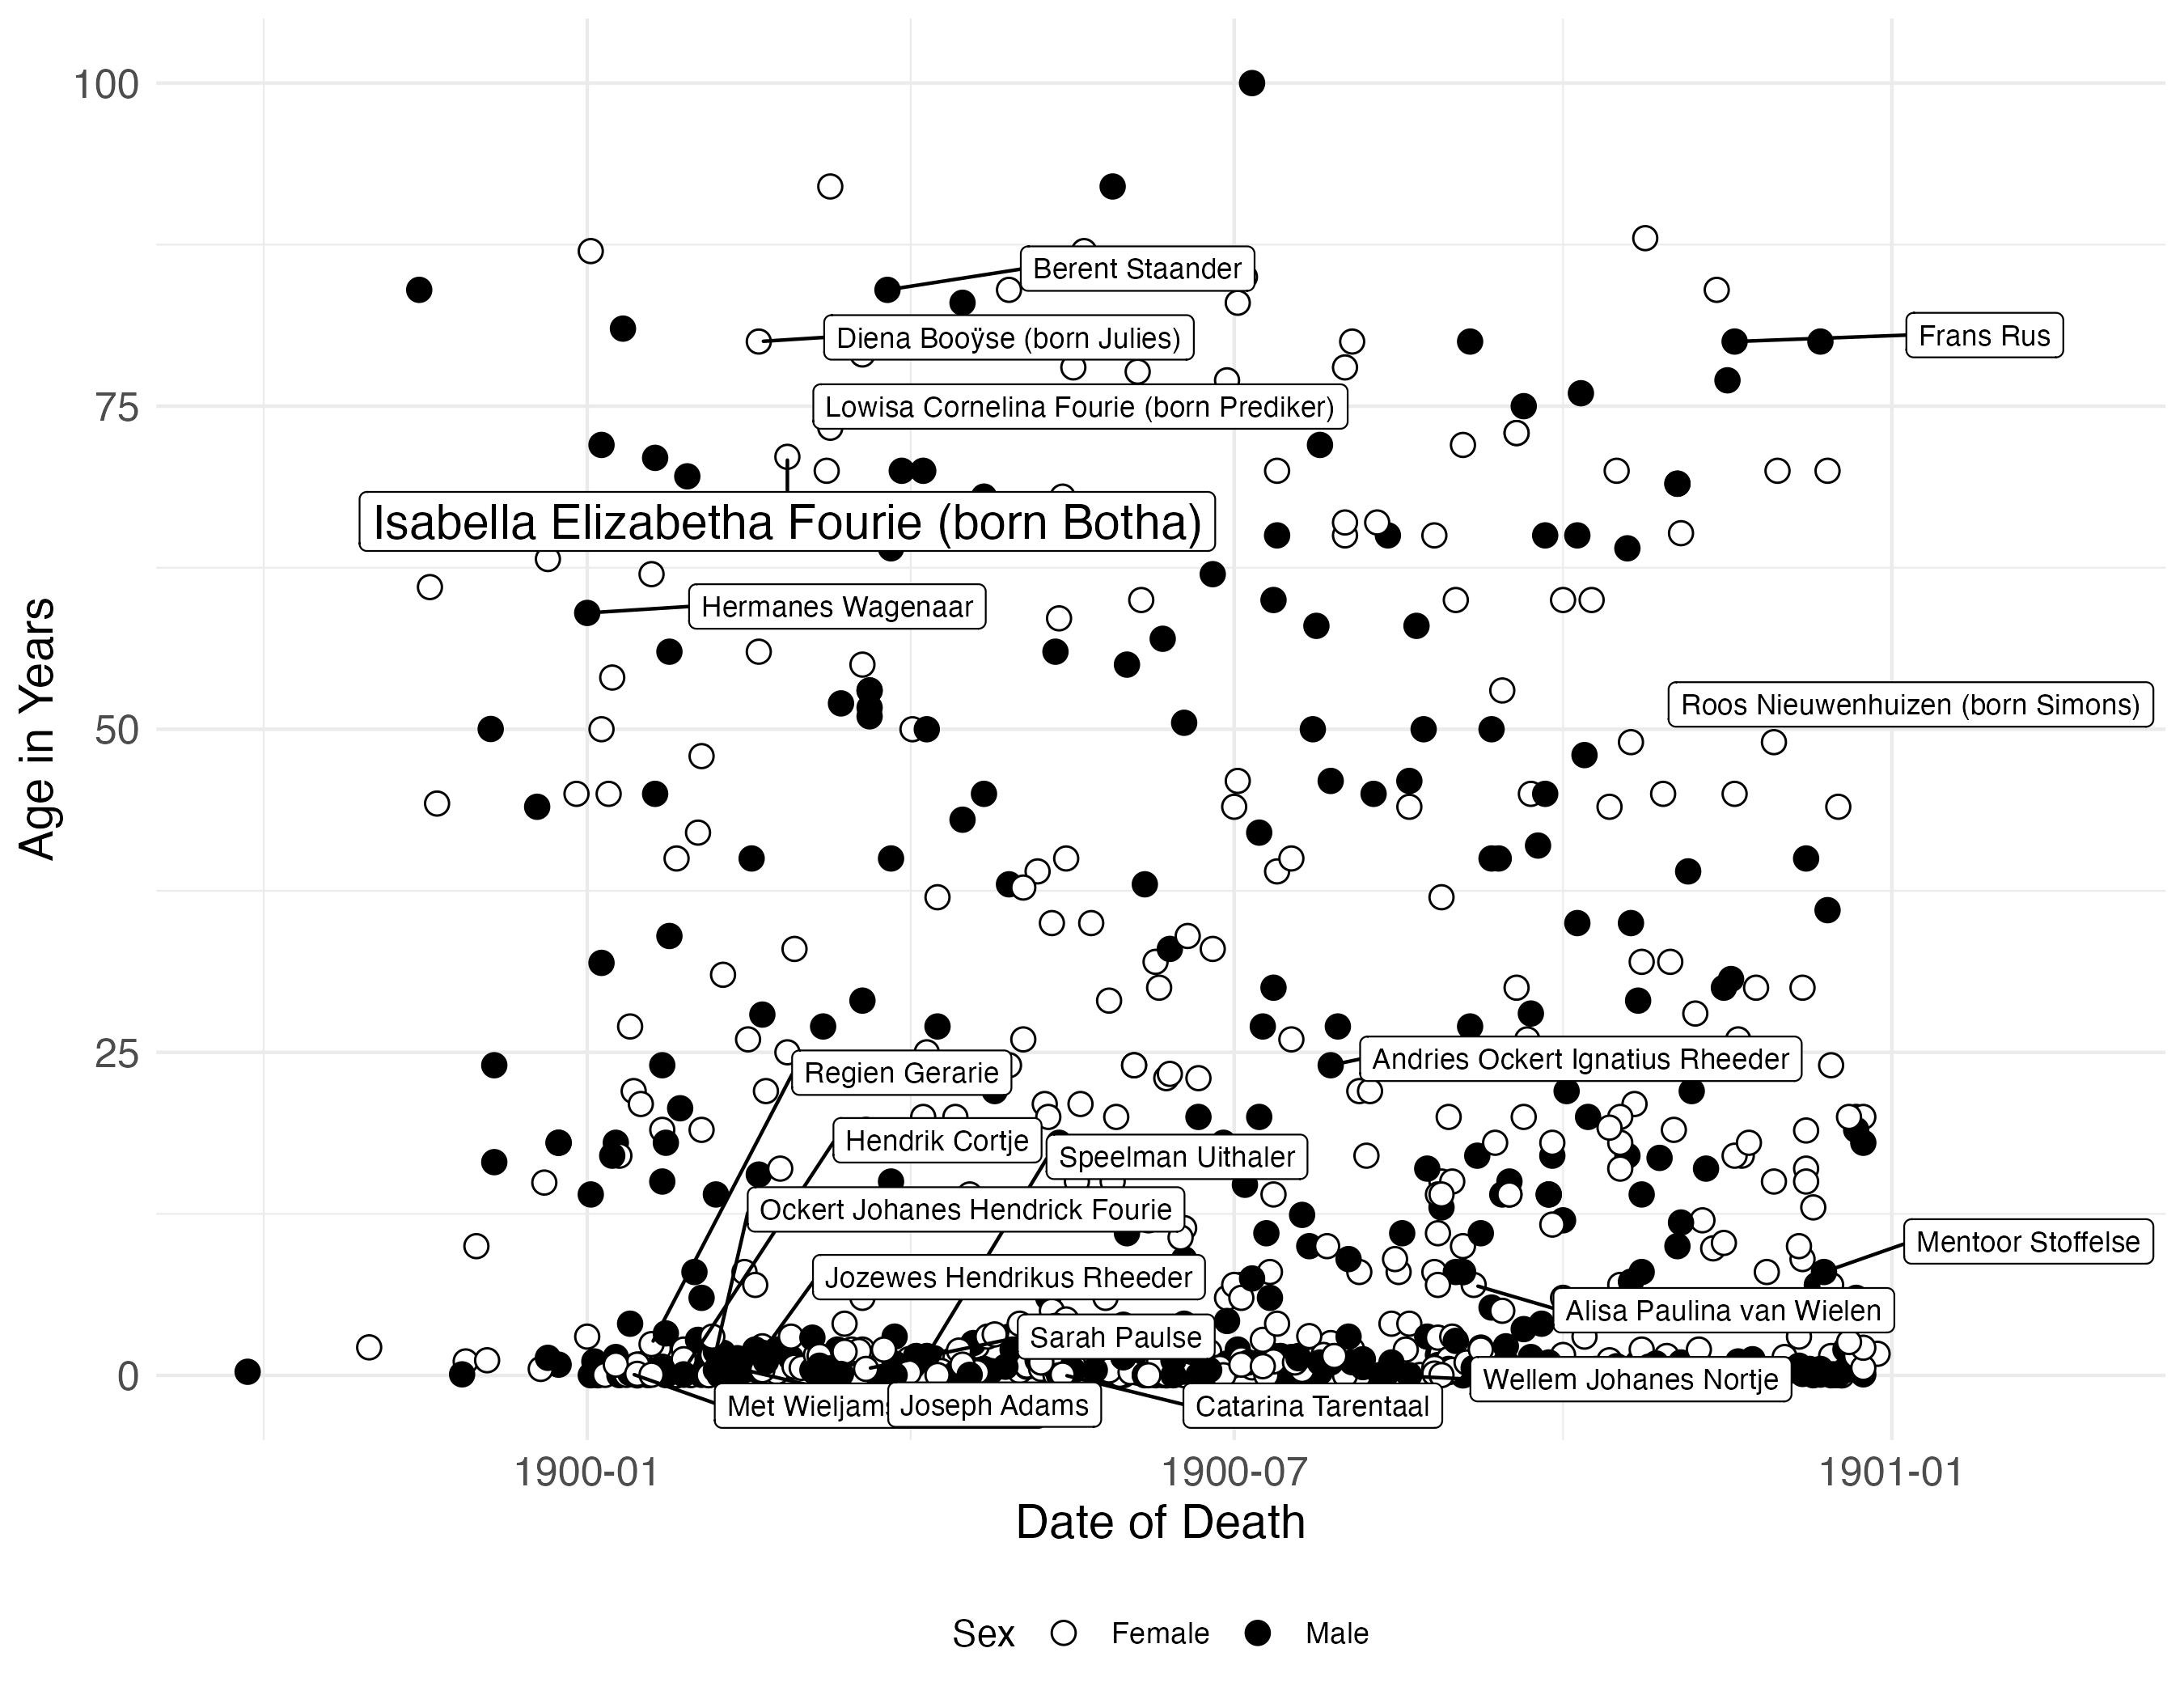
Many of them are the children of labourers. In fact, it is heartbreaking transcribing the thousands of infants who died: an activity that really puts into context the gains in health we’ve made over the last century. As I’ve mentioned, it can also help to expose past inequalities. The next figure shows the density plots for white and coloured residents of Oudtshoorn: that infant mortality was much higher amongst the coloured population – most of them descendants from slaves and Khoesan – is clear.
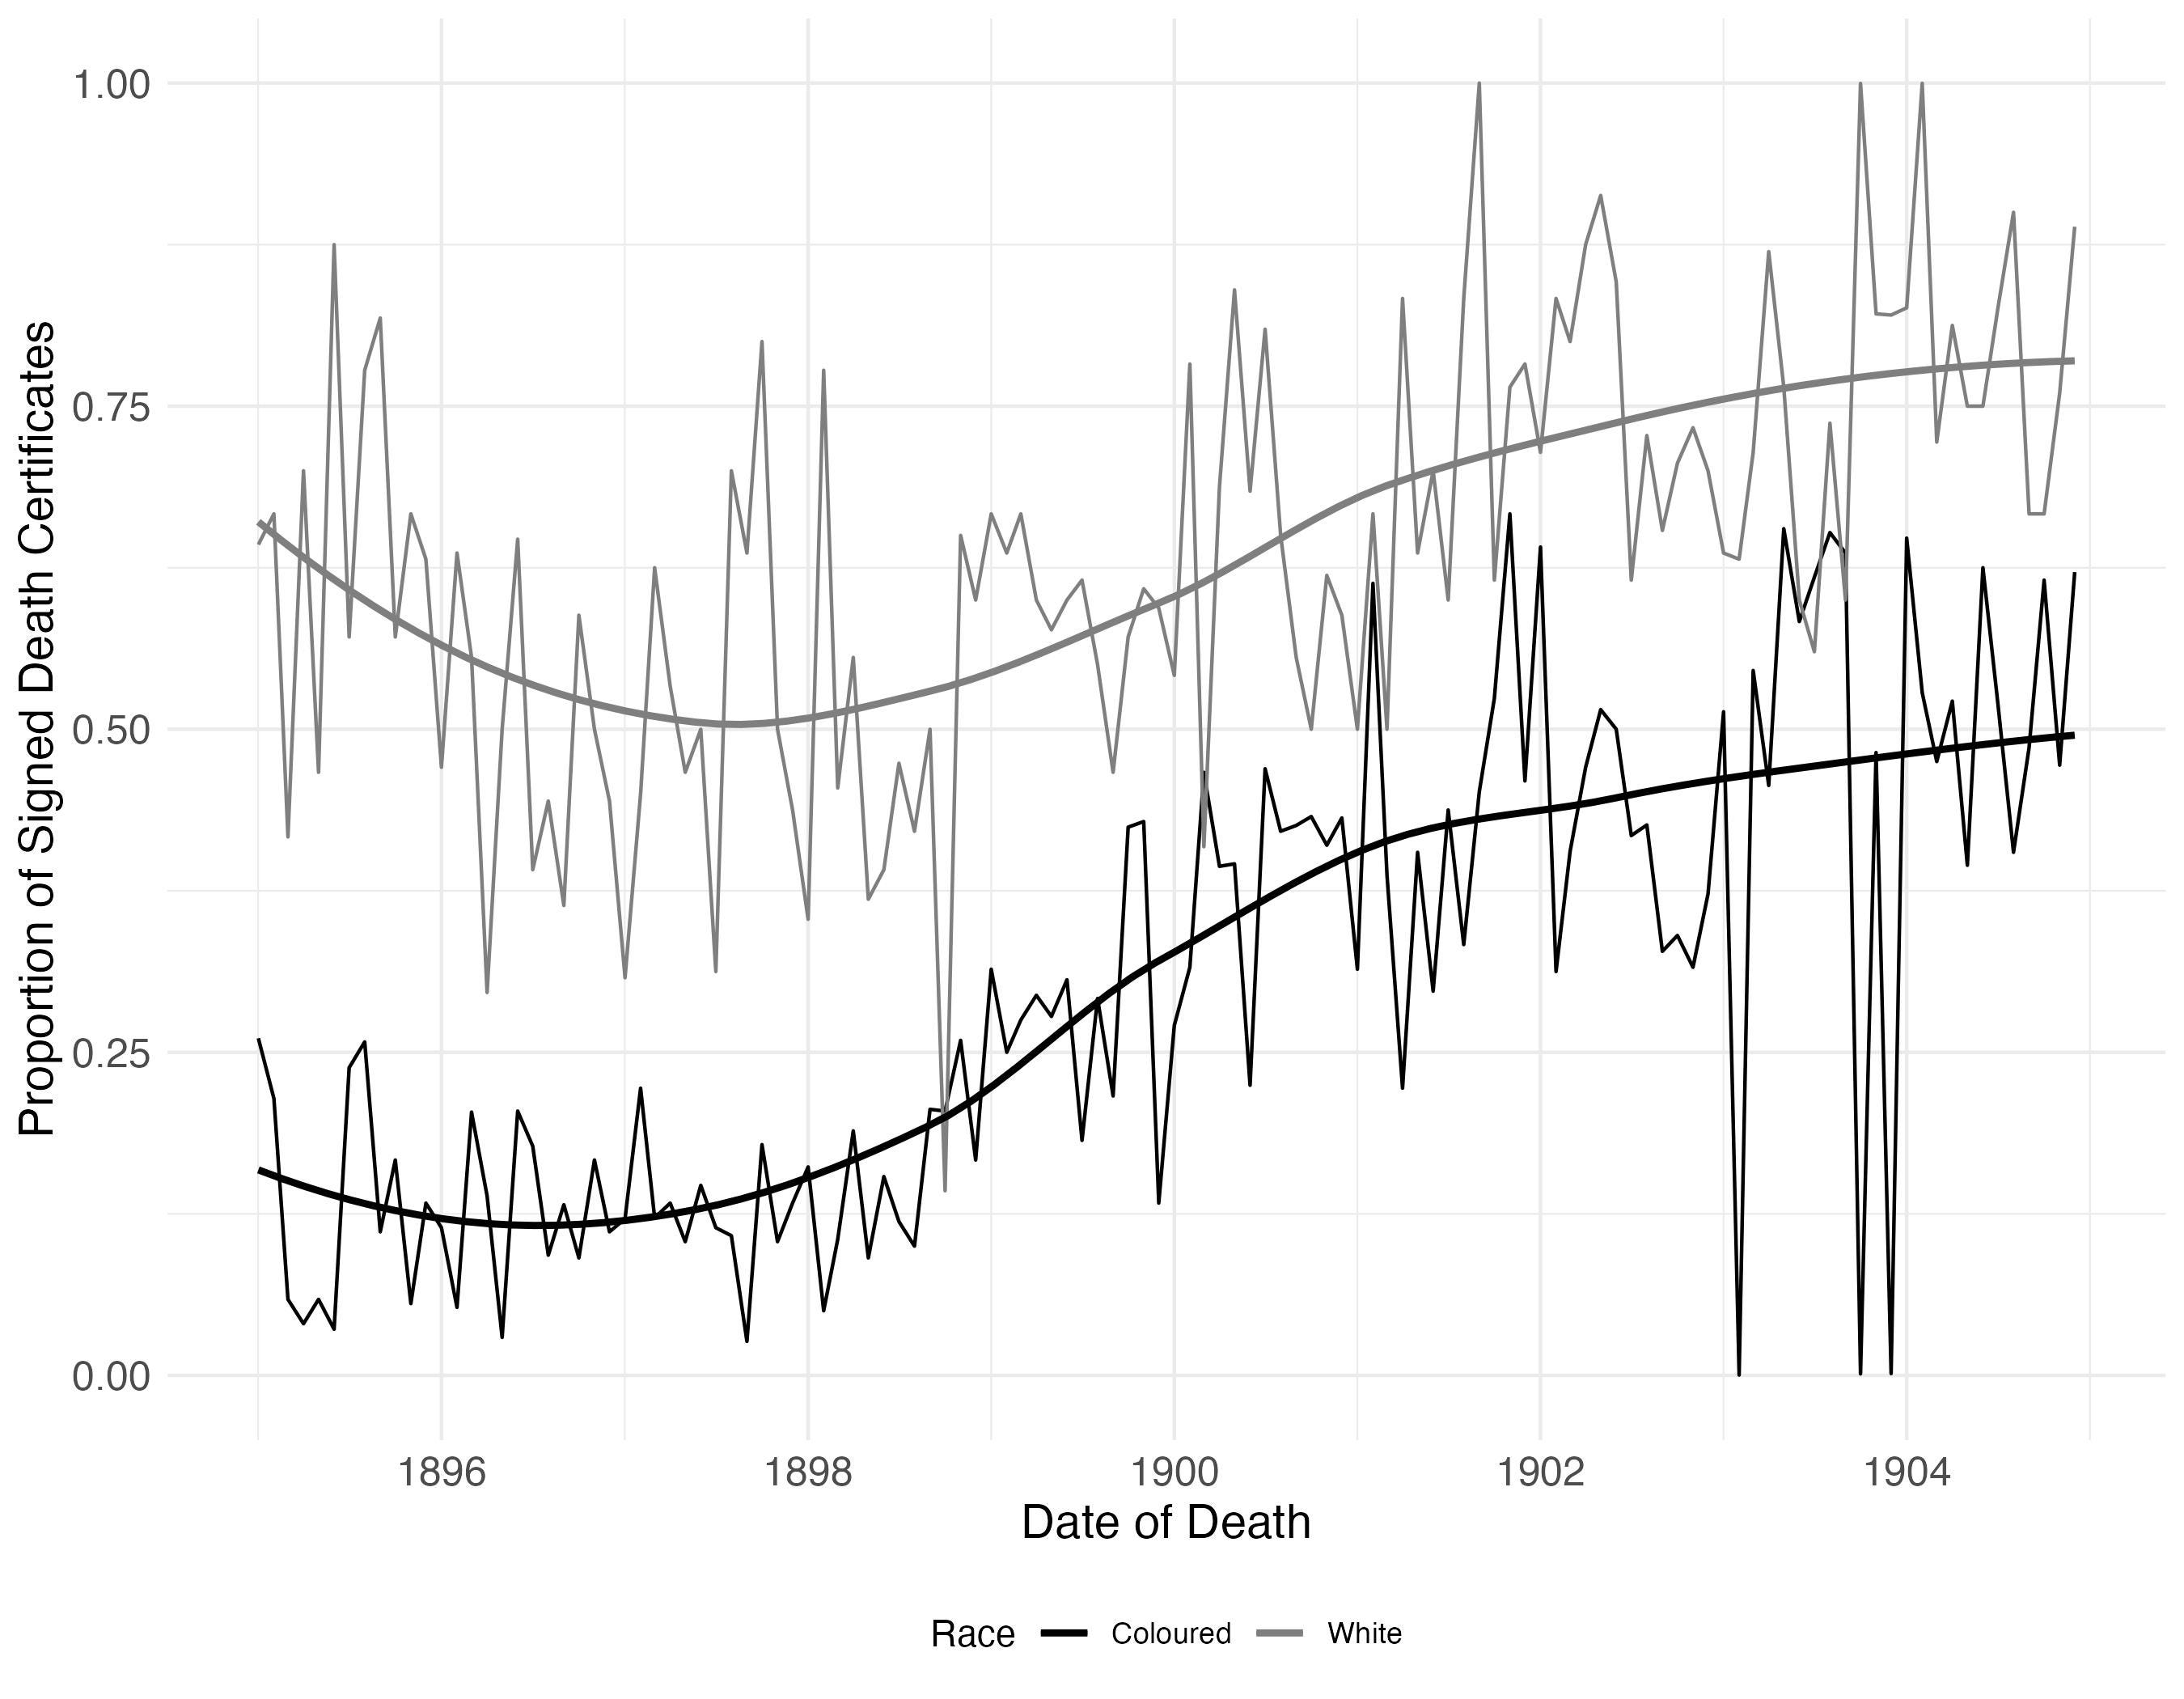
They also had unequal access to healthcare. The figure on the right shows the percentage of death notices signed by a doctor: white residents clearly had better access to healthcare than coloured residents. But there is also an upward trend.
The reason for that is that Oudtshoorn was a rather prosperous place at the time of the birth of Isabella’s grandson, Wynand Breytenbach Fourie, my great-grandfather. The global demand for ostrich feathers all started, as many things do, with the French Revolution – and Marie Antoinette’s trendsetting ostrich-feathered hats. By the turn of the next century, women of all classes across the globe were wearing hats adorned with the hugely popular and now affordable ostrich plumes. Oudtshoorn did well out of the surge in demand: between 1870 and 1900 the wealth of the district increased three times faster than that of the Colony as a whole.
But Oudtshoorn’s boom came to an abrupt end in 1914, when my great-grandfather was 17 years old. The war in Europe was not the only threat to the ostrich trade; the Model T Ford was gaining popularity, and the open motorcar meant that women could not comfortably wear a huge, feathered hat. The change in fashion collapsed the ostrich feather industry, and with it, Oudtshoorn’s prospects.
The third challenge and opportunity, then, is that our work is not unaffected by global changes. Today, because of greater polarisation and isolationism across the developed and developing world – what some might call decoupling – historical demography has an important public role, in connecting the academe to the general public. In my own country, historical injustices still shape contemporary political discourses of racism, exploitation and violence. Here, historical demographers can help, by exposing interconnections and uncovering shared histories – even if contested and complicated. Engaging the public will not be easy, because public history is influenced not just by scientific fashions but also by political considerations, but it is necessary if we want to build a more just and sustainable society.
I will begin to wrap up. Last year on a visit to Amsterdam, I did what all tourists hope to do when they visit: I took a DNA test. (For those wondering, 23andme is not available in South Africa.)
The results came back a few months later. I was not surprised by the fact that much of my DNA can be traced back to the Netherlands, Germany and France. Louis Fourie still sits in my bones.
But given that I know my genealogical record pretty well, I was surprised to discover a few additional sources of DNA. The first, eastern Africa. I consulted an anthropological geneticist and it turns out that eastern Africa reflects my Khoe heritage. The Khoe, the latest research shows, were migrants from Eurasia into Africa long before the Bantu expansion.[15] They had acquired pastoralism and moved down all the way to the southern tip of the continent, eventually intermingling with the San to form what became known as the Khoesan. My Khoesan heritage, then, traces back to my great-grandfather, Wynand Breytenbach Fourie, who had married Johanna Beatrix Zaayman, a Zaayman. And as I mentioned before, the matriarch of the Zaaiman family is Krotoa of the Goringhaikona. (See also this post about my genetic ancestry.)
The second surprise in my DNA test was my south-east Asian DNA: Southern India, Sri Lanka, Indonesia and the Phillippines. It is, of course, from these countries that enslaved people were brought to the Cape. But I have not found my slave ancestor in my genealogical record, yet.
This somewhat light-hearted topic helps to reinforce a more serious challenge and opportunity: that new advances in the hard sciences, from genetics, archaeology, and climatology, have the potential to question or complement our current understanding of the past. As Jerome de Groot argues in Double Helix History, despite concerns about how and by whom genetic data is gathered – fears of biocolonialism – the ‘opening up of new archives of information and genomic data has huge potential to empower Indigenous communities by repatriating our deep past. For multiple groups DNA might enable connection and ownership of pasts that have often been violently erased or stolen.’[16]
Here, too, historical demographers matter. That is because they are ideally placed to bridge not only geographic boundaries but also disciplinary ones. This has the potential, as Michael McCormick describes, to lead to consilience, the convergence of independent, unrelated disciplines, for a more robust understanding of these past interactions.[17] (Although several papers at the conference deal with climatic changes, I found only one referring to genetics.) In short, a diversity of methods can lead to a better understanding of the past.
Let me review the four challenges and opportunities I mentioned at the start of this talk. I have argued that 1) new tools have made untapped global demographic data more accessible, 2) enabling historical demographers to tell the stories of those excluded from conventional archival sources, 3) bridge the gap between academia and the public amid societal divisions, and 4) and foster a deeper understanding of historical interactions through merging disciplinary boundaries.
I think these four challenges and opportunities are both exciting and daunting. It is exciting because it opens the prospect of our research reaching audiences beyond the classroom or academic journal. But it is also daunting because it requires that we confront the challenges of comparing across space and time, using a myriad of methods and speaking to many audiences. It won’t be easy, but as Louis Fourie’s story has shown, an unknown path can sometimes lead to a surprising destination.
[1] The following sections are based on Ockert Fourie, ‘Faurite to Fourie: What’s in a Name?’ Bulletin 58, Huguenot Society of South Africa, 2021, 61-70.
[2] Fourie, Johan, and Erik Green. ‘Building the Cape of Good Hope Panel’ The History of the Family 23, no. 3 (2018): 493-502.
[3] Cilliers, J. and Mariotti, M., 2019. The shaping of a settler fertility transition: eighteenth-and nineteenth-century South African demographic history reconsidered. European Review of Economic History, 23(4), pp.421-445.
[4] Ekama, Kate, Johan Fourie, Hans Heese, and Lisa-Cheree Martin. "When cape slavery ended: introducing a new slave emancipation dataset." Explorations in Economic History 81 (2021): 101390.
[5] Ekama, Kate. "Bondsmen: Slave Collateral in the 19th-Century Cape Colony." Journal of Southern African Studies 47, no. 3 (2021): 437-453.
[6] Fourie, Johan, ed. Quantitative History and Uncharted People: Case Studies from the South African Past. Bloomsbury Publishing, 2023.
[7] Fourie, Johan. ‘Quantitative History and Uncharted People’ Quantitative History and Uncharted People: Case Studies from the South African Past, Bloomsbury Publishing, (2023), p. 1.
[8] Fourie, Johan, and Francisco Marco-Gracia. ‘Sex Ratios and Girl Preference In the Cape, 1894–2011’ Quantitative History and Uncharted People: Case Studies from the South African Past, Bloomsbury Publishing (2023), p. 63.
[9] Rommelspacher, Amy. ‘Domestic Service in Cape Town before the Second World War’, Quantitative History and Uncharted People: Case Studies from the South African Past, Bloomsbury Publishing (2023), p. 169.
[10] Richardson, Laura, and Jan Kok. ‘Bridal Pregnancy in the Mother City, 1900–60’, Quantitative History and Uncharted People: Case Studies from the South African Past, Bloomsbury Publishing (2023), p. 33.
[11] Fourie, Johan. ‘Quantitative History in Practice’, Quantitative History and Uncharted People: Case Studies from the South African Past, Bloomsbury Publishing (2023), p. 353.
[12] Lemercier, Claire, and Claire Zalc. "Back to the Sources: Practicing and Teaching Quantitative History in the 2020s." Capitalism: A Journal of History and Economics 2, no. 2 (2021): p. 484.
[13] Jayes, Jonathan, and Johan Fourie. ‘Death During the Influenza of 1918’, Quantitative History and Uncharted People: Case Studies from the South African Past, Bloomsbury Publishing (2023), p.317.
[14] Fourie, Johan, and Jonathan Jayes. "Health inequality and the 1918 influenza in South Africa." World Development 141 (2021): 105407.
[15] Vicente, Mário, and Carina Schlebusch. "Ancient DNA studies and African population history." Africa, The Cradle of Human Diversity: Cultural and Biological Approaches to Uncover African Diversity, eds. C. Schlebusch, C. Fortes-Lima and E. Mtetwa.(Leiden: Brill) (2022): 236-256.
[16] De Groot, J. 2023. Double Helix History. Routledge. P. 84.
[17] McCormick, Michael. "History's changing climate: climate science, genomics, and the emerging consilient approach to interdisciplinary history." Journal of Interdisciplinary History 42, no. 2 (2011): 251-273.
Johan, what is that picture you've used to represent Louis? Title and artist? Presumably a detail from some larger painting?