The optimal (Protea) cricket team
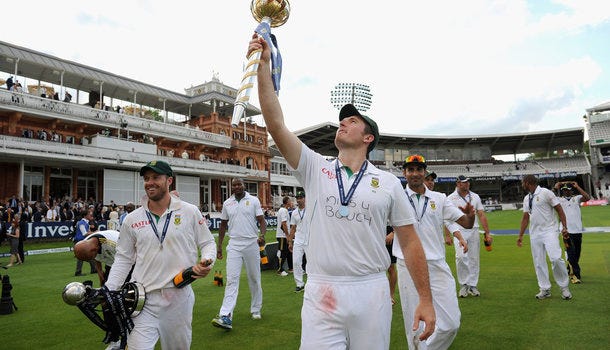
How many 'I's' are there in Statistics? Graeme Smith celebrates being on top of the world.
Monday was an exciting day for South African cricket: not only did the Proteas beat England to win the series 2-0, but because of the win, the Proteas are now the nr 1 test team in the world. And rightfully so, I might add, given the comprehensive way in which they beat the former test nr 1. Even so, it could have been very different. Had Graeme Swann and Matthew Prior remained at the crease for another five overs, or South Africa scored 30-odd fewer runs, the result may have been very different. Which made me think about Mark Boucher: would we have been in this position had Boucher played? Surely we lost very little in the wicket-keeping department. I remember only one missed opportunity from AB de Villiers in the whole series. And although Jacques Rudolph did not add much with the bat (averaging 35), JP Duminy would probably not have played if Bouch had been available, which would have lowered our final day total by, say, 50 runs, the margin by which we won (JP averaged 67 in the series, although his highest total was 61 on the fourth-day of the final test).
But such questions about team composition struggle to factor in intangibles like experience (Boucher would have played his 150th test at Lord's). What about coaching and mental fitness, as one Cricinfo author recently explained the difference between South Africa and England? Can team selections really just be based on statistics? A recent paper by Kelcey Brock, Gavin Fraser and Ferdi Botha of Rhodes University suggests we can. The paper, published in the Journal for the Studies of Economics and Econometrics (SEE), attempts to identify the most optimal strategy for a cricket team to win, by constructing a production function for South Africa's domestic cricket teams participating in the SuperSport Series between 2004 and 2011.
A production function is simply a way to specify the outputs of a firm, an industry or an economy, in terms of inputs. In this case, the output is match success, and the inputs are various statistics that cricket followers will be familiar with: batting averages, bowling averages, runs per over, etc. Instead of basic OLS, the authors use a technique known as Stochastic Frontier Analysis and find that, for South Africa and on average, an attacking batting strategy and a defensive bowling strategy has the highest likelihood of a successful outcome. The results are very similar for Australia, but different to England and New Zealand, where an attacking bowling strategy leads to the best results.
I do think there are some issues with the paper. I would have like to see different inputs and controls (for example, pitch quality, time effects, perhaps even star Protea players). How are drawn matches treated in the data? And, more importantly, are the coefficients economically meaningful and how are they interpreted? The coefficient for bowling average, for example, is consistently positive and large, but the authors attach greater weight to their "Defensive Bowling"-variable, which has a smaller coefficient. And, even if the results are backed up by solid statistical evidence, what does this imply for team selection? Do we just select batsmen with an attacking frame of mind and bowlers like Vernon Philander who has a masterful control of line and length?
Nevertheless, such analyses begin to show the usefulness of economic techniques in the world of sports, an exciting prospect. Here's hoping the Proteas find their optimal team selection before they tour Australia at the end of the year. Quinton de Kock anyone?
*Image source: Getty Images.


