The curious case of regional GDP*
Are we actually measuring what we should?
This is a free post from Our Long Walk, my blog about South Africa's economic past, present, and future. If you enjoy it and want to support more of my writing, please consider a paid subscription to the twice-weekly posts, which include my columns, guest essays, interviews, and summaries of the latest relevant research.
Two months ago, I invited a senior economist from one of South Africa’s major metros to a workshop. Our discussion was about how economists can help cities design better policies. His slide deck included a graph with regional GDP per capita figures for South Africa over the last decade. My interest was piqued, for two reasons. First, I was curious about the origins of the city-level GDP statistics. Quantec, a data consultancy, provides modelled municipal-level statistics, but he was using a different source. Secondly, and more importantly, why was the Western Cape, and Cape Town in particular, growing slower than the rest of the country?
I tell my students that any good economist must have a strong sense of smell. That is because much of what we do requires a ‘sniff test’, the ability to intuitively assess whether something seems right or wrong. And looking at that graph of regional growth rates, something smelled off.
Why? Because a host of different indicators now show that the Western Cape is outperforming the rest of the country. Property prices in the Western Cape are rising faster than elsewhere in the country, while the unemployment rate is falling more rapidly than the country average. Tourist arrivals to Cape Town via air recorded a 13% year-on-year increase between January and April this year. Cape Town is already spending more on infrastructure than other metros, and this trend will continue. According to the tabled 2023/24 capital budgets for SA’s metros, Cape Town will invest more in infrastructure than Johannesburg and Durban combined over the three-year medium-term budget framework.
Or, for the ultimate ‘sniff test’, just listen to any Capetonian complain about traffic.
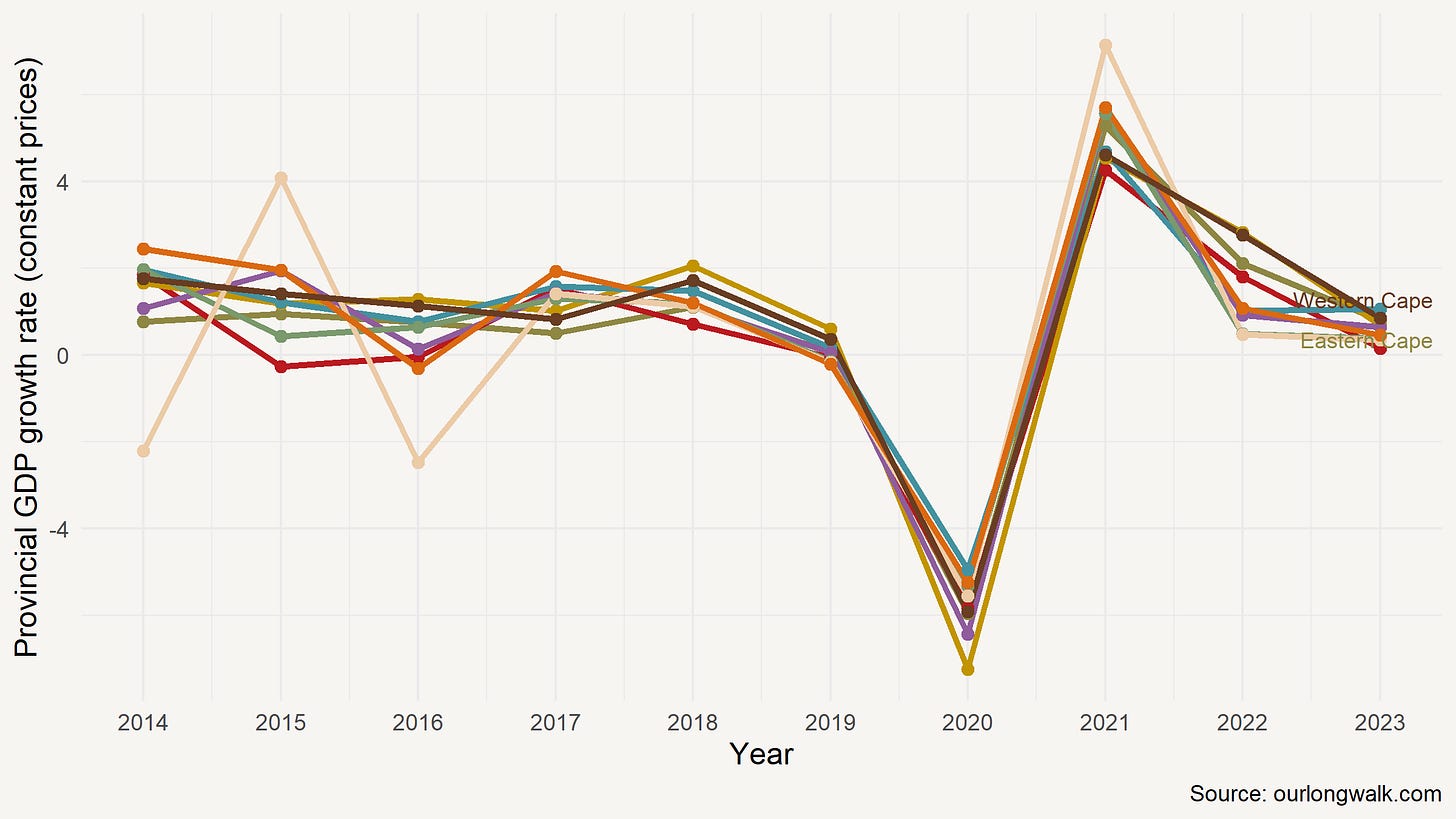
But perhaps this was simply my own home bias at work. So I downloaded the latest StatsSA provincial GDP figures (in constant prices) and plotted them, just to compare.
And, indeed, the Western Cape is doing better, disproving the data of the senior economist. But it did not outperform the rest by much; as the figure above shows, its average annual growth over the last decade was a paltry 0.91% compared to the second-placed 0.87% of KZN.
Drawing this graph, I had the same sensation: something was not quite right. Consider the Eastern Cape, with an annual average of 0.6%. Do we really believe that the Western Cape is only growing marginally faster than the Eastern Cape, the same province that, only a few months ago, was worried about a recession?
I don’t think so. Here is just one reason: these GDP numbers do not account for population size. Whereas provinces like Gauteng and the Western Cape have seen large numbers of migrant arrivals, contributing to total production (if not necessarily to per capita production), that is not true for the Eastern Cape. The population of the Eastern Cape today has exactly the same population size it had in 2001. There are two reasons for this: fertility rates have come down substantially and many migrants leave the Eastern Cape in search of better opportunities. Given this, I would have expected a much much larger gap between GDP growth in the Western Cape and Eastern Cape.
This is a very long-winded way of saying that perhaps – and I say this with trepidation, knowing the implications – we are not measuring GDP very accurately. Here’s another ‘sniff test’ that has puzzled me for a while: in 2023, we had more than 6,500 loadshedding hours, almost three times as much as in 2022. And yet, we still maintained a positive (though small) growth rate. When energy is the key input into almost any form of production in every sector, how do you still manage to produce the same output as the year before? Or, consider the inverse. We had no loadshedding during the winter of 2024 compared to 153 days of loadshedding in the previous winter. Is it really possible that we’re only producing 1% more output this year compared to last?
Of course, concerns about GDP as an indicator of economic activity are not unique to South Africa.
As Katherine Abrahams notes in a 2022 paper, the core infrastructure underlying the production of economic statistics, in South Africa and elsewhere, dates in large part to the 1930s and 1940s. Then, the only way to gather information was through extensive surveys of households and businesses, designed to provide accurate and representative snapshots of economic activity. But, today, surveys are far less reliable due to declining response rates. People and businesses are increasingly reluctant or unable to participate, whether due to survey fatigue, privacy concerns or the sheer volume of requests they receive. (For example, when last did you complete a voluntary survey?) This makes it increasingly difficult to obtain reliable data, thereby undermining the accuracy of GDP figures.
Another issue is that GDP may exclude the value of certain products and services that have become free or significantly cheaper, often due to technological advancements. Many digital goods and services – such as social media platforms, search engines and open-source software (or this blog post!) – are provided at no monetary cost to the user. While these innovations greatly enhance productivity and improve living standards, their value is not reflected in GDP calculations because no market transaction occurs. This means that GDP may underestimate the actual economic progress, especially as the pace of technological improvement speeds up.
A final issue is more applicable to South Africa. There are worrying signs about the quality of other government statistics, most notably the 2022 South African Census. As this report makes clear, the undercount rate, at an unprecedented 31%, was over double that of the previous census in 2011. Issues included overestimations of certain age groups, demographic inconsistencies and implausible migration figures. Delays in data collection, a poorly-timed post-enumeration survey and incomplete release of crucial demographic data, such as fertility and mortality figures, exacerbated the problems. The report suggests it is StatsSA that is largely to blame, noting logistical mismanagement, inadequate oversight of adjustments to the census data and failing to deliver reliable estimates. If this is true for the Census, could it not be true for other indicators as well?
The good news is that better alternatives are becoming more readily available. Public and private Big Data enables statistical agencies to capture real-time, granular insights that traditional surveys cannot easily provide. By harnessing naturally occurring data – such as scanner data, credit card transactions or geolocation patterns – statistical agencies can improve the timeliness, accuracy and disaggregation of economic statistics. This shift not only addresses declining response rates but also enhances our ability to monitor dynamic economic conditions and respond to emerging trends more effectively. These alternative sources complement survey data rather than replace them, offering benchmarks – statistical ‘sniff tests’ – to ensure reliability.
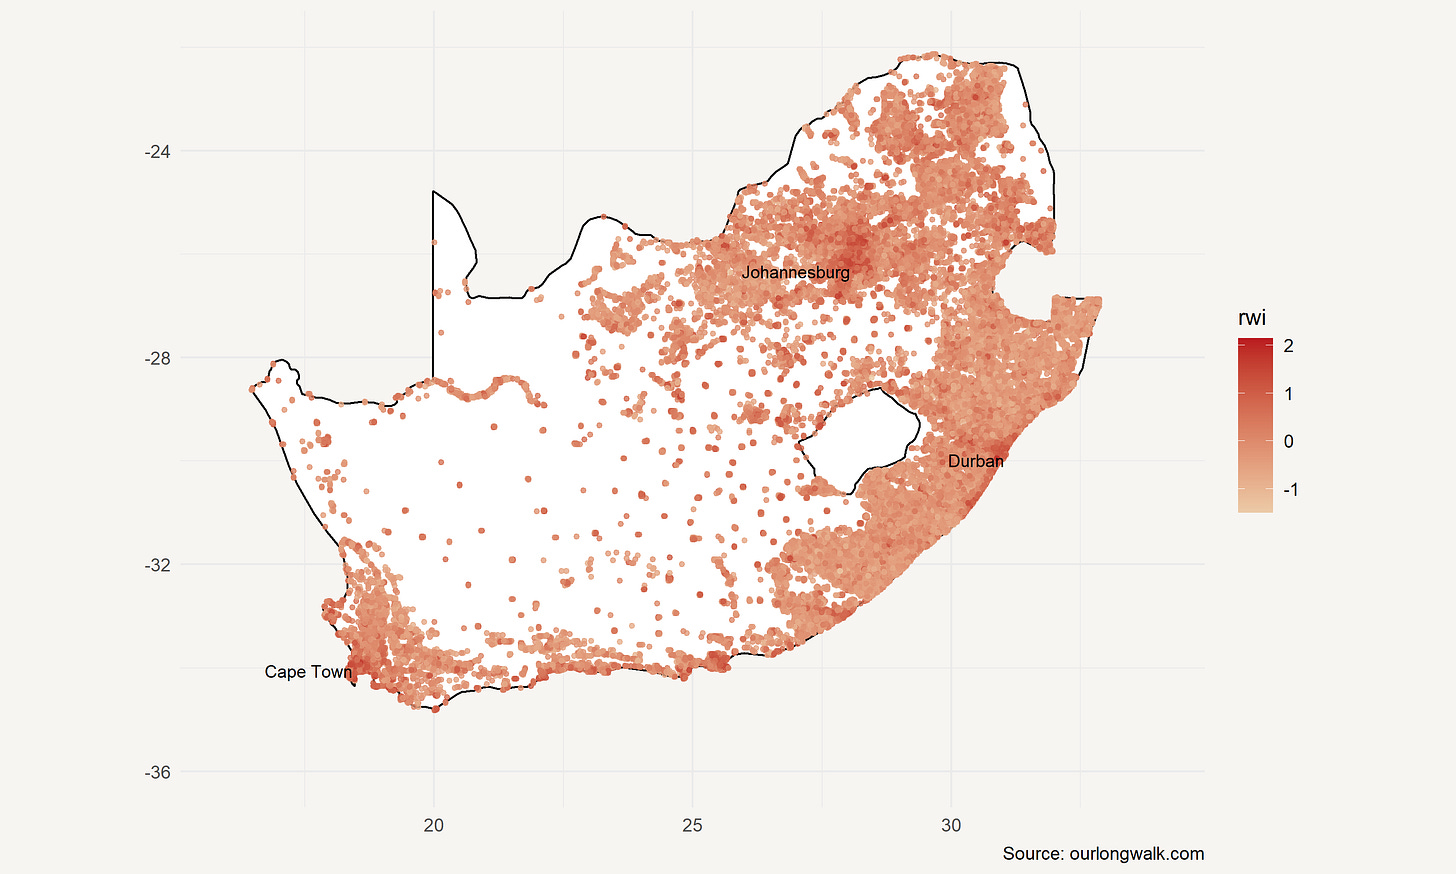
Consider Facebook, a social media platform with widespread use. In 2022, Meta, the owner of Facebook, published a relative wealth index based on privacy-protecting connectivity data, satellite imagery and other novel data sources they have access to. I downloaded the data for free (not accounted for in GDP!) and plotted the graph below (using free software). While this is not directly comparable to GDP (it is a stock rather than a flow variable), it reveals the richness of data that could complement existing data sources. If we had such an RWI over time, for example, we could easily cross-reference whether the provincial growth rates are indeed what they appear to be.
No data is perfect, of course. There must be lots of experimentation and validation. But statistical agencies will have to realise that their role has changed from providing ‘gold standard’ statistics to producing real-time indicators that can help policymakers to address pressing societal needs.
*UPDATE:
Since this was published on News24 two weeks ago, StatsSA has released new GDP estimates. These suggest that the economy contracted by 0.3% in the third quarter, reversing growth of the same margin experienced in the second quarter. This was largely driven by a 29% drop in the agriculture, forestry and fishing industry during the period.
29%? I find that incredibly hard to believe. I am not the only one. Here is CEO of Agri SA, Johann Kotzé: ‘We don’t agree with the data. The numbers do not make sense.’
Such errors matter. They determine whether firms choose to invest. They impact the Reserve Bank’s decision about the interest rate. Here is the title of the editorial in the Business Day a day after the GDP figures were released: ‘GDP figures shock calls for faster pace of reforms’.
If we can’t believe these numbers, and I think there are now good reasons to think that they are problematic, then what is the alternative? Time for an independent economics observatory, perhaps.
An edited version of this article was published on News24. Support more such writing by signing up for a paid subscription. The images were created with Midjourney v6.


Fascinating!
If you were to put on your academic hat, what do you reckon we'll be using as a metric in 20 years? Or has it not been discovered?