


Togo’s 2006 household survey contains a small demographic miracle. Women aged 50 are plentiful; women aged 49 are scarce. Children who have just turned five abound, but children a few months younger are mysteriously missing. No birth register on earth produces age patterns like these – fieldworkers do.
The reason is workload. In the great international household surveys – the Demographic and Health Surveys and UNICEF’s cluster surveys, the raw data much development research depends on – a fieldworker first lists everyone in the household, then must sit down for a long individual interview with everyone who qualifies: every child under five, every woman aged 15 to 49. Each eligible person found means another hour at the kitchen table. Nudge a 49-year-old to 50 on the roster, or leave a toddler off the list, and the interview evaporates. The point: Fieldworkers respond to incentives, just like the rest of us.
Why should South Africans care about Togolese rosters? Because we live on survey numbers. The Bureau for Economic Research in Stellenbosch has measured business confidence for decades. Business and community forums poll its members on everything from load-shedding to the impact of AI. StatsSA’s household surveys tell us who works and who goes hungry. And a far larger industry asks who you will vote for, then converts the answers into election forecasts. Press any of these surveyors on accuracy and, sooner or later, you will hear the same reassurance: with a big enough sample, the results can be believed.
It sounds sensible. Ninety years ago, it killed a magazine.
In 1936 the Literary Digest, an American weekly, mailed out ten million straw ballots and received 2.4 million back – the biggest election poll ever run. It predicted a comfortable victory for Alf Landon. Franklin Roosevelt won 46 of the 48 states. George Gallup, using a sample roughly one-fiftieth the size but built to resemble the actual electorate, called the result correctly. The Digest had compiled its mailing list from telephone directories, car registrations and club memberships – in Depression America, a register that included only wealthy people. Two years later the magazine was gone.
With surveys, bigger is not always better. A growing sample helps you in one way only: chance errors shrink, so your estimate becomes more precise. But precision and accuracy are two different things. If the people in your sample differ systematically from the people outside it, that gap – selection bias – does not shrink by a single decimal point as the sample grows. A biased sample of two million is not closer to the truth than a biased sample of two hundred. It is merely wrong with more confidence.
Which returns us to the vanishing Togolese women, and to a new working paper that measures the problem at planetary scale. The economists Torsten Figueiredo Walter and Niclas Moneke noticed an accidental experiment buried in the surveys’ design. Many of them also carry a men’s questionnaire, administered only in a random subset of households, to save time and money. That randomisation created a worldwide test of fieldworker temptation: in households assigned the men’s questionnaire, every eligible man recorded means extra work; in control households he costs nothing. If fieldworkers were faithful scribes, the two sets of rosters would look identical. They do not.
Across 181 surveys and 3.4 million households in 73 countries, the treatment households contain fewer eligible men. Nearly three in four surveys show the pattern. In those, almost one eligible person in eleven has been screened out. And the missing are a very particular slice of humanity: disproportionately the disabled, the chronically ill, the unschooled, the never-married and the poor – precisely the people official statistics want to see. Correct for the phantom men and the numbers change: fertility estimates fall by 5–10%, child mortality is about 1% higher than reported, child marriage estimates drop by 7%. These are the figures on which the Sustainable Development Goals are tracked. The problem reaches research, too: the deep forces economists study – climate, institutions – turn out also to predict how much selection a survey suffers, contaminating the very regressions meant to measure them.
And then there is South Africa.
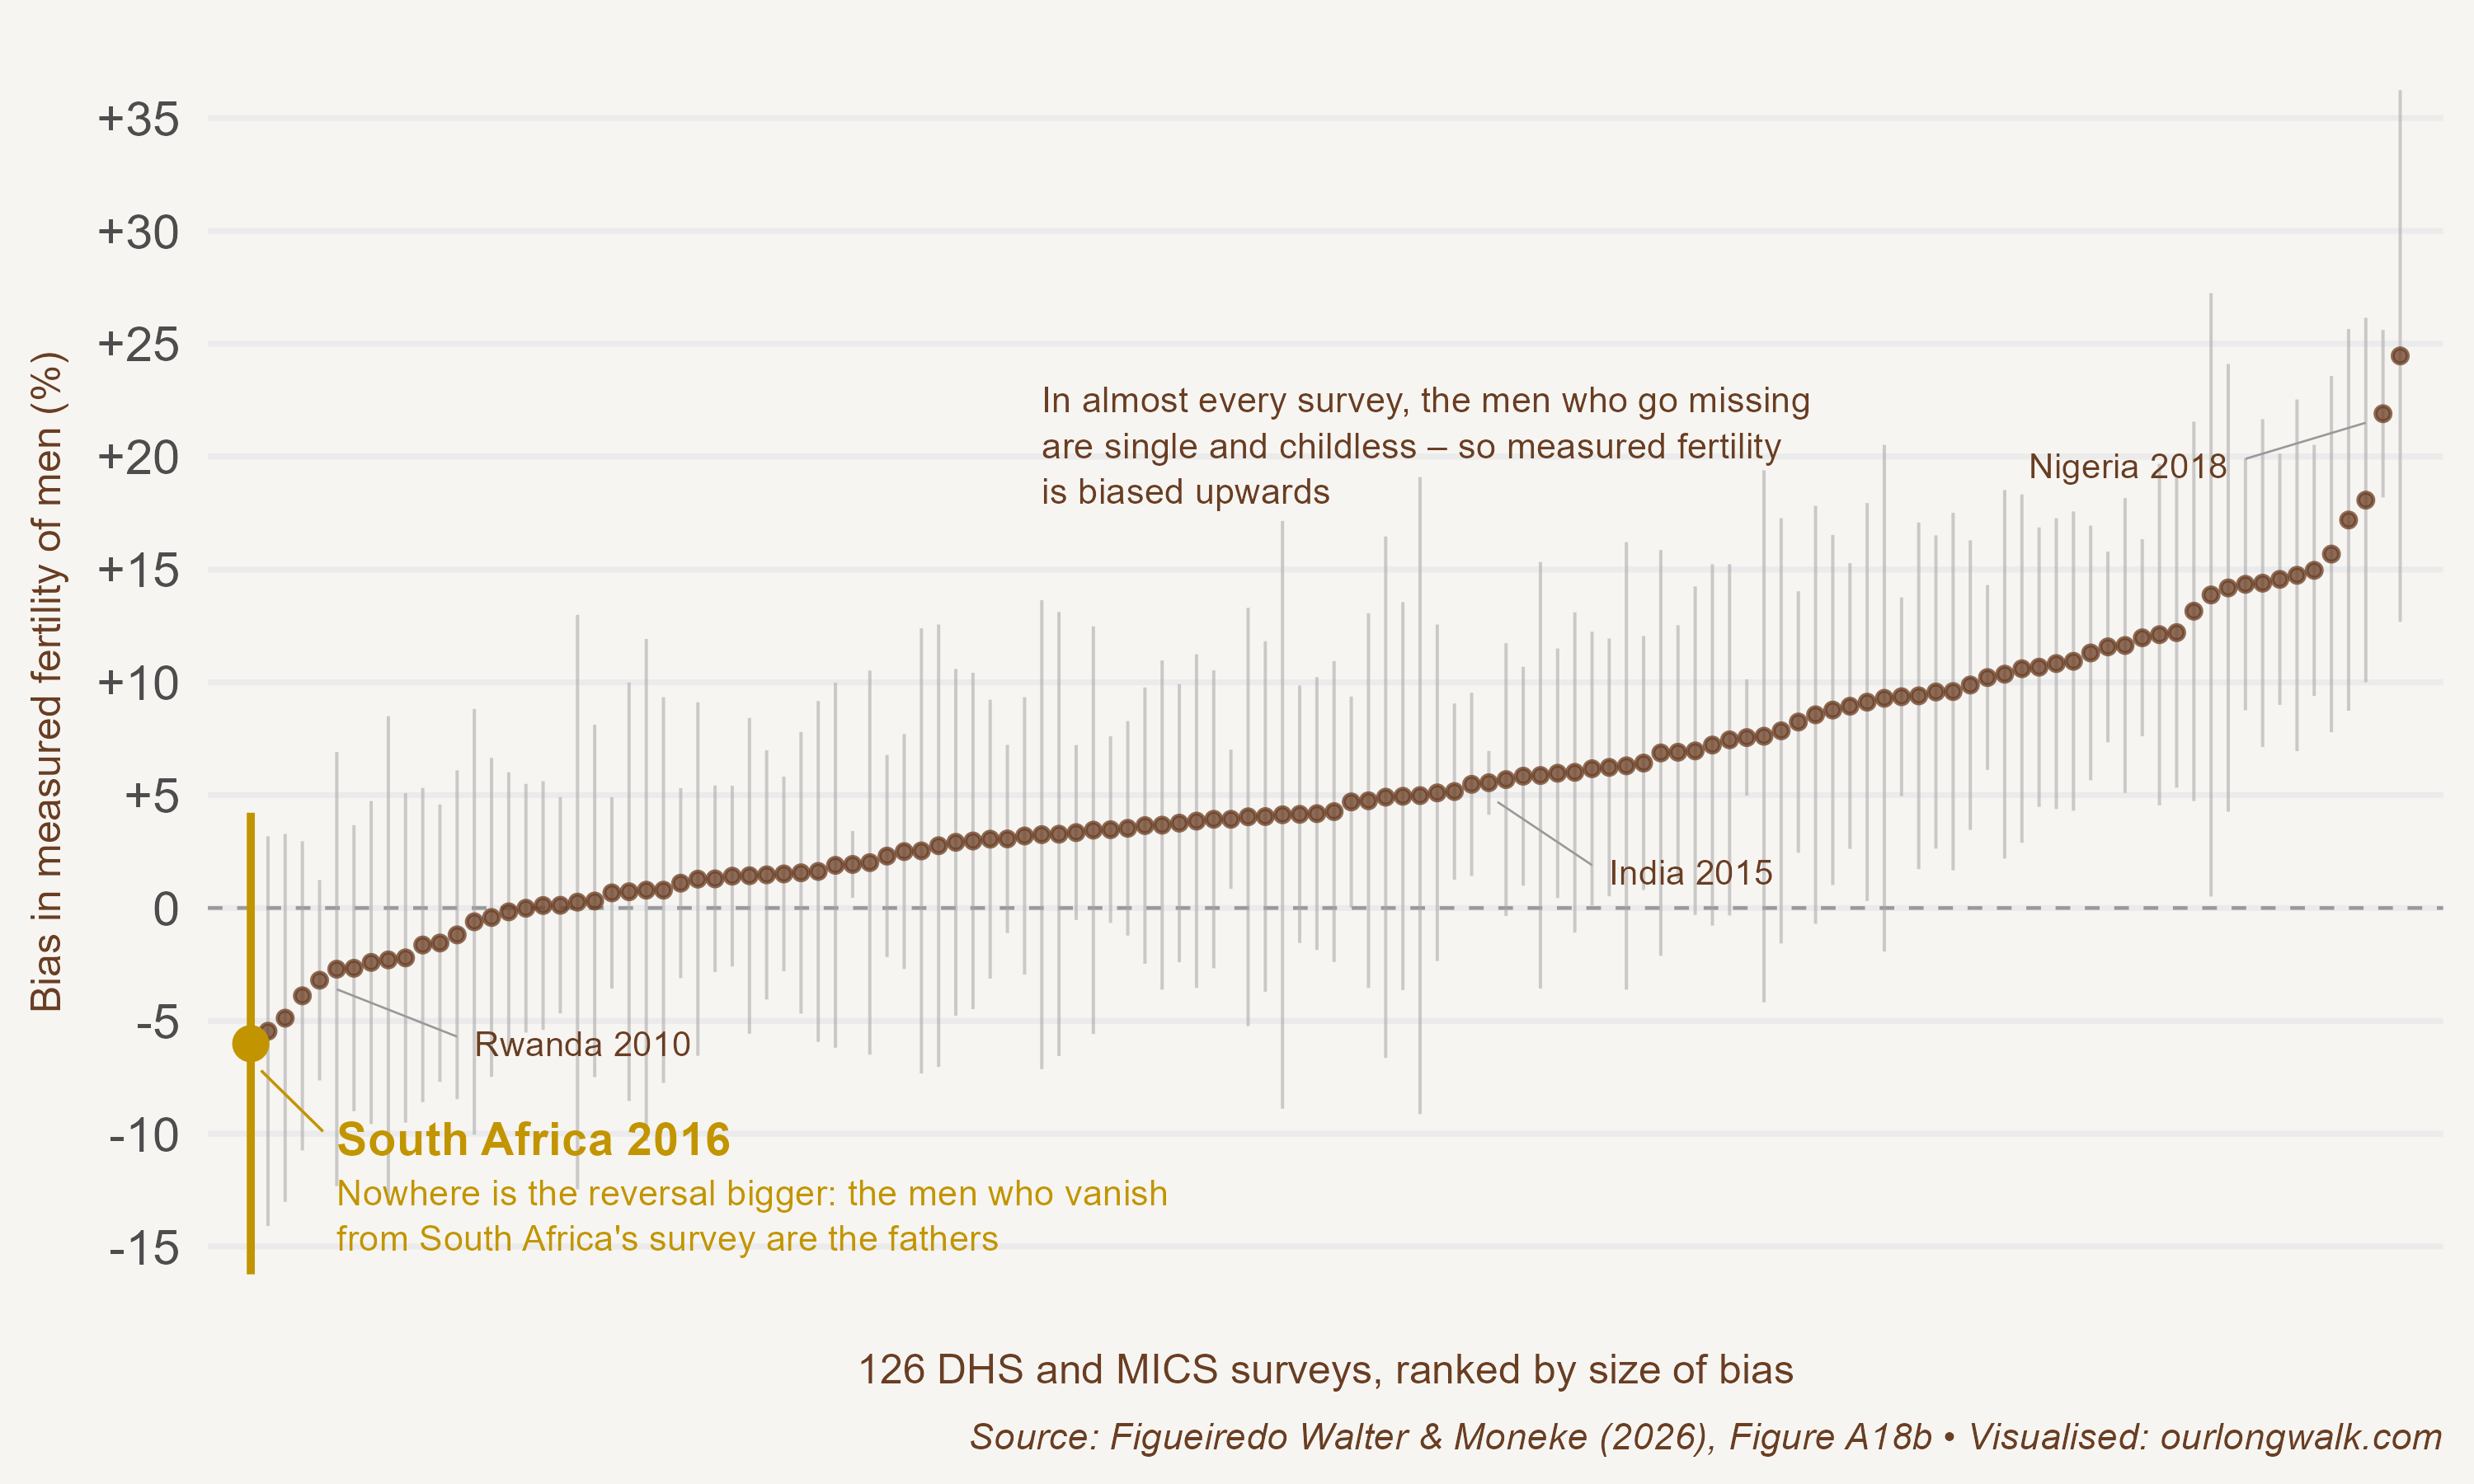
In almost every survey, the men who go missing are single and childless, so the measured fertility of the men who remain is inflated – by more than a fifth in Nigeria’s 2018 survey. South Africa’s 2016 Demographic and Health Survey sits at the opposite extreme of all 126 surveys where this can be measured: men’s measured fertility is biased downwards, by about 6%. The estimate is noisy – the confidence band is wide – but nothing else comes close on that side of zero. And the same reversal appears in the survey’s marriage statistics. Elsewhere, the phantom men are bachelors. Here, the men who vanished were the fathers.
The authors make nothing of this – South Africa never appears in their text – so treat what follows as my own back-of-the-envelope assessment. South Africa is the country where, according to StatsSA’s latest General Household Survey, 64.5% of children do not live with their biological fathers – a legacy of the migrant labour system that spent a century separating men from their families. Where a man’s residence is fluid, the fieldworker has discretion. And discretion follows effort. My guess is that the men easiest to strike from a busy roster were the men whose household ties were fullest and most complicated. The consequence is perverse: the survey thinned the already thin ranks of fathers. This can have large consequences: a correction factor calibrated on the other 125 surveys would adjust South Africa’s numbers in precisely the wrong direction.
So must we bin the surveys – the confidence indices, the polls, the household statistics? The 2025 John Bates Clark Medal argues the opposite. It went to Stefanie Stantcheva of Harvard, who a decade ago left a celebrated career in optimal-tax theory to ask people, in meticulously designed surveys, what they actually think. Steve Levitt told her on his podcast earlier this year that the move had looked like ‘career suicide’, because ‘there are few things economists hate more than survey research’. Economists, as Stantcheva put it, ‘do not believe what people say. We only believe what they do.’ Her answer was to make the asking rigorous: a single questionnaire can take her team more than a year to design before it reaches the field. Says Stantcheva:
When some people reached out to me to run their own survey, it has almost always started with, “I didn’t realize how hard this is!”
That is the sentence I would pin above every survey release in the country. The BER’s economists know how hard it is, as do StatsSA statisticians. The best pollsters know it too, which is why you should carefully consider the method before you trust any of the (mad) predictions about South Africa’s forthcoming local elections.
Sample size buys precision and nothing else. A survey that cannot say who was in its frame, who declined and who was quietly dropped has not earned belief – whatever its n. That standard applies to a business-confidence index, an AI-adoption poll and an election forecast alike. And it applies with extra force in the age of big data, where millions of observations lend unearned authority to unexamined selection. The Literary Digest’s 2.4 million ballots produced an estimate precise to a tenth of a percentage point – and wrong by almost twenty. Size isn’t everything. Selection is.